Question 1
1(a):
Here are the heights, in cm, of 20 sunflower plants.
54, 93, 56, 34, 49, 29, 93, 37, 20, 9,\\ 50, 13, 23, 36, 83, 22, 39, 99, 82, 49The ordered stem and leaf diagram for this information is shown below

Find the values for x, y and z.
ANSWER: Multiple Answers (Type 1)
Answer: x = 9, y = 2, z = 3
Workings:
The values that have not yet been submitted into the diagram are 29, 82 and 93
Marks = 3
1(b):
What does the following statement describe?
“Add together all the numbers and divide by how many numbers there are.”
ANSWER: Multiple Choice (Type 1)
A: Calculating the Mean
B: Calculating the Median
C: Calculating the Mode
D: Calculating the Range
Answer: A
Workings:
The mean is found by finding the sum of all the values and dividing it my the total number of values used.
Marks = 1
Question 2
Students in a year 8 class took a Science test.
The stem and leaf diagram below shows the results.

2(a):
How many pupils are in the class?
ANSWER: Simple Text Answer
Answer: 31
Workings:
Count up how many values there are in the diagram.
Marks = 1
2(b):
Find the modal mark
ANSWER: Simple Text Answer
Answer: 33
Workings:
Find the most frequently occurring result in the diagram.
Marks = 1
2(c):
Find the median mark
ANSWER: Simple Text Answer
Answer: 55
Workings:
n=31
\dfrac{32}{2} = 16
The 16_{th} result in the diagram is 55
Marks = 1
Question 3
The stem and leaf diagram below shows the scores of 24 students in a competition.
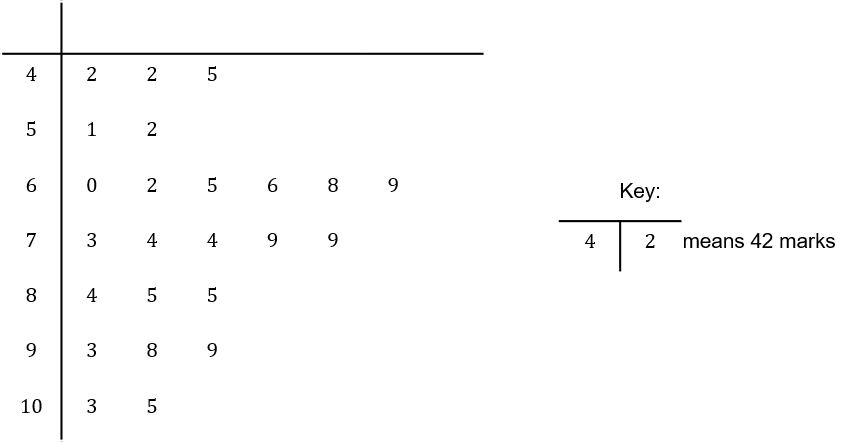
3(a):
Find the median score
ANSWER: Simple Text Answer
Answer: 73.5
Workings:
\dfrac{n+1}{2} = \dfrac{24+1}{2} = \dfrac{25}{2} = 12.5
The 12_{th} value is 73 and the 13_{th} value is 74
The average of these two values is 73.5
Marks = 1
3(b):
Find the range of scores
ANSWER: Simple Text Answer
Answer: 63
Workings:
Subtract the smallest value in the diagram from the largest.
105-42 = 63
Marks = 1
3(c):
What percentage of the students scored 60 or less?
ANSWER: Simple Text Answer
Answer: 25%
Workings:
Count the number of students who scored 60 or less = 6.
Divide by the total number of students,24, and multiply by 100.
\dfrac{6}{24}\times 100 = 25\%
Marks = 2
Question 4
Pupils in a PE lesson were timed to see how fast they could run 100m.
The times, in seconds, are shown below.
21, 23, 22.5, 20.7, 19.8, 21.7, 21, 21.3, 20.6, 19.3,\\ 20.8, 17.5, 18.4, 17.4, 22.1, 22, 21.1, 18.2, 16,4, 19.84(a):
The diagram below shows an ordered stem and leaf diagram representing the above information.
What are the values for x, y and z?

ANSWER: Multiple Answers (Type 1)
Answer: x=2, y=16 and z=4
Workings:
The missing piece of data from the diagram is 18.2 so x=2
The left hand side of the key represents the whole number part of the time and the right hand side represents the decimal part.
So, in the example given in the key, y = 16 and z = 4.
Marks = 3
4(b):
Find the median time.
ANSWER: Simple Text Answer
Answer: 20.75 seconds
Workings:
\dfrac{n+1}{2} = \dfrac{20+1}{2} = \dfrac{21}{2} = 10.5
The tenth value is 20.7, the eleventh value is 20.8.
The average of these two values is 20.75 seconds.
Marks = 1
4(c):
Afterwards, it was discovered that the time 19.9 seconds had been missed off the original list of data.
If this piece of data had been included, what effect would it have on the median from part (b)?
Choose the correct statement.
ANSWER: Multiple Choice (Type 1)
A: The median would decrease
B: The median would stay the same
C: The median would increase
D: The median would decrease by 1
Answer: A
Workings:
Because this new value is smaller than the value found in part (b), there are now more values below the median than above it, so the new median must be smaller.
Marks = 1
Question 5
The time taken, in minutes, for 20 pupils to get to school was recorded.
A student was asked to draw an ordered stem and leaf diagram for the data, which is shown below.
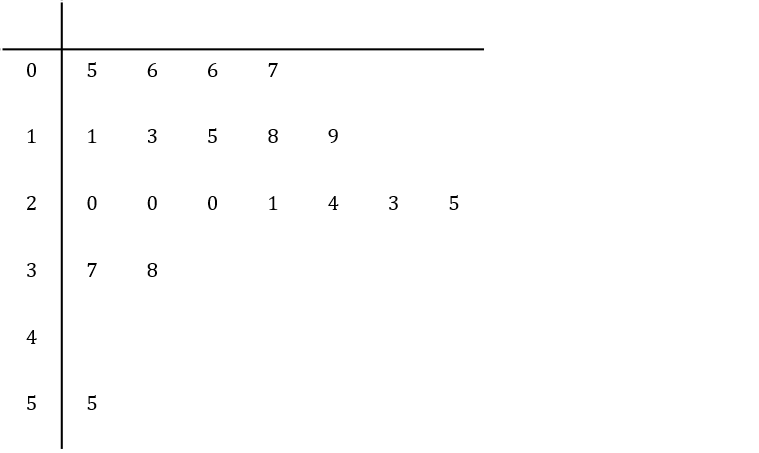
The student has not drawn the stem and leaf diagram correctly.
Identify which of the following is a mistake made by the student.
ANSWER: Multiple Choice (Type 1)
A: Not enough pieces of data in the diagram
B: Too many pieces of data in the diagram.
C: Row 0 is incorrectly ordered.
D: Row 1 is incorrectly ordered.
Answer: A
Workings:
The question states that 20 pupils were surveyed, yet there are only 19 values in the diagram, so one must be missing.
Marks = 3
Question 6
The ages of men and women at a bowling club were recorded, and the results are shown below.

Which of the following is an accurate comparison of the distributions of the ages of men and women?
ANSWER: Multiple Choice (Type 1)
A: Male data has positive skew; Female data is symmetrical.
B: Male data has negative skew; Female data is symmetrical.
C: Male data has positive skew; Female data has negative skew.
D: Male data is symmetrical, Female data has positive skew.
Answer: A
Workings:
As the ages of the men increase, there are fewer men in each age group, so it has a positive skew.
For the women’s group, the middle group is the 50s. Looking either side of this group shows that the same pattern occurs from either end, so the data is symmetrical.
Marks = 3