Two-Way Tables FSQ1
Some students were asked whether they preferred Maths, English or Science.
The results are summarised in the table below.

Two-Way Tables FS1(a)
How many female students prefferred Maths?
Answer type: simple
Answer: 29
Workings:
64 students in total preferred Maths, of which 35 were male.
The number of female students that prefer Maths is therefore: 64-35-29
1 mark
Two-Way Tables FS1(b)
How many male students preferred English?
Answer type: simple
Answer:
The total amount of students is 250
64 prefer Maths and 112 preferred Science, so the remaining amount preferred English, which is:
250-64-112=74The number of male students that preferred English is therefore:
74-28=461 mark
Two-Way Tables FS1(c)
How many female students preferred Science?
Answer type: simple
Answer: 86
Workings:
There are 112 students that preferred Science, of which 26 were males.
The number of female students that preferred Science is therefore:
112-26=861 mark
Two-Way Tables FS1(d)
What is the total number of male students?
Answer type: simple
Answer: 117
Workings:
The total number of students is 250
133 students are female, so 250-133=117 students are male
1 mark
Two-Way Tables FSQ2
The table below displays the number of goals scored by a football team during their league fixtures.

Two-Way Tables FS2(a)
In what fraction of the home fixtures did the team score 2 goals?
Give your answer as a fraction in its simplest form.
Answer type: fraction
Answer: 3 / 10
Workings:
There are 20 home fixtures, and 2 goals were scored in 6 of them. So the fraction of home fixtures the team scored 2 goals in is:
\dfrac{6}{20}=\dfrac{3}{10}1 mark
Two-Way Tables FS2(b)
In what fraction of the away fixtures did the team score 3 or more goals?
Give your answer as a decimal to two places.
Answer type: simple
Answer: 0.25
Workings:
There are 5 away fixtures in total where the team scored 3 or more goals.
As a fraction of the total number of away games, this is \dfrac{5}{20}=0.25
1 mark
Two-Way Tables FS2(c)
In what fraction of the total fixtures did the team score 5 goals?
Give your answer in its simplest form.
Answer type: fraction
Answer: 1 / 40
Workings:
There is only 1 fixture in which the team scored 5 goals and 40 fixtures were played in total.
As a fraction, this is \dfrac{1}{40}
1 mark
Two-Way Tables FSQ3
Rodrick, Jane and Tyson each toss a coin and record the number of times it lands on heads or tails.
The data is tabulated below.

Two-Way Tables FS3(a)
How many of Rodrick’s coin tosses landed on tails?
Answer type: simple
Answer: 23
Workings:
Number of tails = 40- number of heads
=40-17=231 mark
Two-Way Tables FS3(b)
How many of Jane’s coin tosses landed on heads?
Answer type: simple
Answer: 37
Workings:
Number of heads = 75- number of tails
=75-38=371 mark
Two-Way Tables FS3(c)
How many of Tyson’s coin tosses landed on tails?
Answer type: simple
Answer: 44
Workings:
Tyson’s total number of coin tosses is 200-75-40=85
Number of tails = 85- number of heads
=85-41=441 mark
Two-Way Tables FS3(d)
Calculate the total number of heads and the total number of tails.
Answer type: multiple answers
Answers:
- heads = 95
- tails = 105
Workings:
Total heads = 17+37+41=95
Total tails =23+38+44=105
2 marks
Two-Way Tables FSQ4
A group of 274 people were asked about their favourite genres of films.
Their responses are summarised in the two-way table below.

Complete the final column of the table, giving the total number of responses for each genre.
Answer type: multiple answers
Answers:
- Action = 37
- Comedy = 71
- Thriller = 60
- Documentary = 51
- Other = 55
Workings:
The totals can be calculated by adding up the values in the ‘Under 20′, ’20-40’ and ‘Over 40’ columns,
e.g. total for action genre = 16+13+8=37
3 marks
Two-Way Tables FSQ5
The table below shows the set-menu options chosen by guests at a dinner party.

Two-Way Tables FS5(a)
Give the total number of people who chose each option.
Answer type: multiple answers:
Answers:
- Chicken = 13
- Pork = 7
- Lamb = 10
- Vegetarian = 7
Workings:
The total for each option can be calculated by adding up the columns,
e.g. chicken =2+3+1+4+3=13
2 marks
Two-Way Tables FS5(b)
How many people were at the dinner party?
Answer type: simple
Answer: 37
Workings:
The total can be calculated by adding up the ‘total’ column:
6+4+5+10+4+8=371 mark
Two-Way Tables FS5(c)
What percentage of the people on Table 6 chose pork?
Answer type: simple
Answer: 25 %
Workings:
There are 8 people on Table 6, 2 of which chose pork.
This is equivalent to \dfrac{2}{8}\times 100 = 25 \%
1 mark
Two-Way Tables FS5(d)
If a person is randomly selected, what is the probability they chose the vegetarian option?
Give your answer as a fraction in its simplest form.
Answer type: fraction
Answer: 7 / 37
There are 7 people who chose the vegetarian option and 37 people in total. Hence the probability that a person chose the vegetarian option is \dfrac{7}{37}
Two-Way Tables FSQ6
The table below shows the competition record of 4 swimmers in a swimming club.

Two-Way Tables FS6(a)
Who has the highest win/loss ratio?
Answer type: multiple choice
Answer: Rachel
Wrong answers:
Sanjay
Mike
Igor
Workings:
To calculate the win/loss ratio for each swimmer, the table must first be completed. The completed table is shown below:
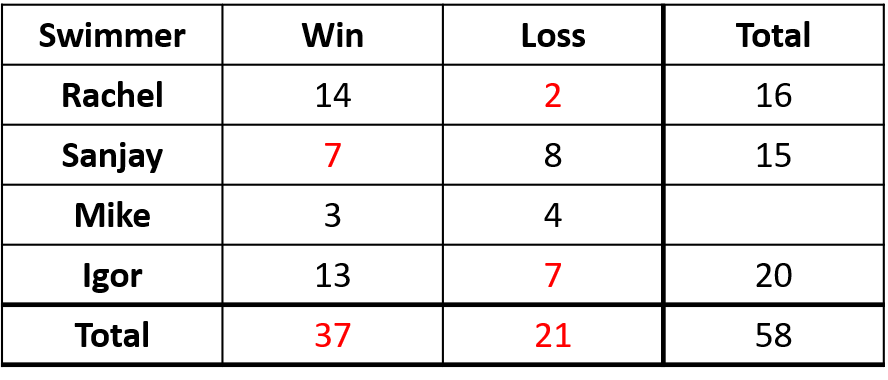
The win/loss ratio for each swimmer is:
- Rachel: 14 \div 2 = 7
- Sanjay: 7 \div 8 = 0.875
- Mike: 3 \div 4 = 0.875
- Igor: 13 \div 7 = 1.86
Therefore Rachel has the highest win/loss ratio.
4 marks
Two-Way Tables FS6(b)
What fraction of the total number of races were won by the four members of the team?
Give your answer in its simplest form.
Answer type: fraction
Answer: 37 / 58
There were 58 races in total, and 37 were won by the team members.
As a fraction, this is \dfrac{37}{58}
1 mark