Question 1:
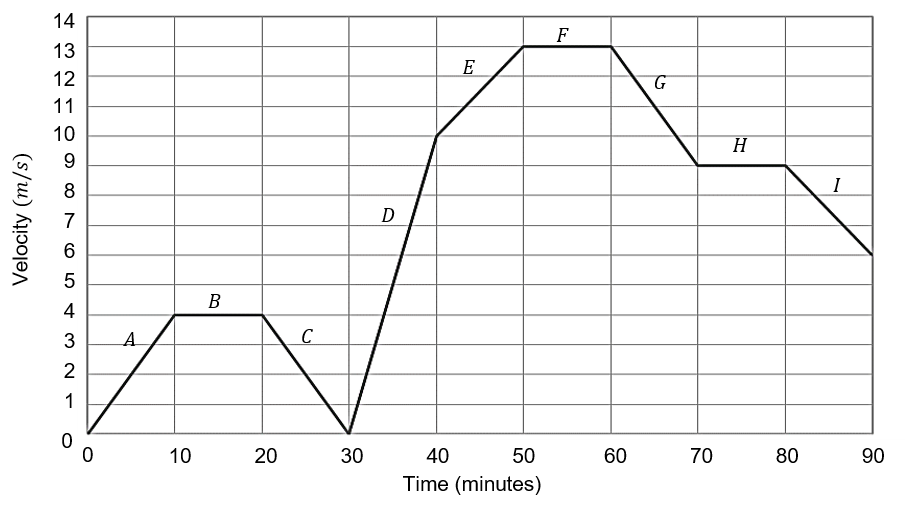
Anna’s car journey is shown on the velocity-time graph below.
Question 1(a): [1 mark]
In which sections is Anna accelerating?
Answer type: Multiple choice type 1
A: A, C, D, F, G, I
B: B, F
C: A, D, E
D: C, G, I
ANSWER: C: A, D, E
WORKING:
Sections with a positive gradient.
Question 1(b): [1 mark]
In which sections in Anna’s velocity constant?
Answer type: Multiple choice type 1
A: A, C, D, F, G, I
B: B, F
C: A, D, E
D: C, G, I
ANSWER: B: B, F
WORKING:
Sections with zero gradient.
Question 1(c): [1 mark]
In which section is Anna’s acceleration the greatest?
Answer type: Multiple choice type 1
A: A
B: D
C: G
D: I
ANSWER: D
Question 1(d): [1 mark]
In which two sections does Anna have the same deceleration?
Answer type: Multiple choice type 1
A: A and C
B: E and I
C: C and G
D: B and F
ANSWER: C: C and G
Question 2:
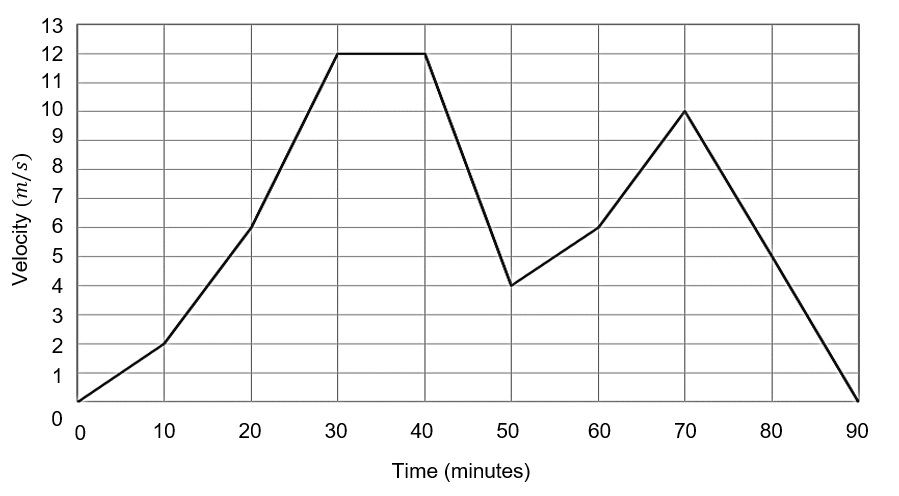
The velocity-time graph below shows Brian’s daily journey.
Question 2(a): [2 marks]
What is the largest acceleration over the course of Brian’s journey?
Answer type: Multiple choice type 1
A: 0.01 m/s
B: 0.0067 m/s
C: 0.1 m/s
D: 0.013 m/s
ANSWER: A: 0.01 m/s
WORKING:
Steepest positive gradient is between 20 and 30 minutes.
\dfrac{12-6}{10 \times 60} = \dfrac{6}{600} = 0.01 m/s
Question 2(b): [3 marks]
What is the estimated total distance travelled by Brian over the course of the journey?
Answer type: Multiple choice type 1
A: 37200 m
B: 10800 m
C: 35800 m
D: 38200 m
ANSWER: A: 37200 m
WORKING:
Split the graph into appropriate sections, as follows:
Calculate areas, and multiply by 60 to convert minutes into seconds.
A: \dfrac{1}{2} \times 12 \times 30 \times 60 = 10800
B: 10 \times 12 \times 60 = 7200
C: \dfrac{1}{2} \times 10 \times (12 + 4) \times 60 = 4800
D: \dfrac{1}{2} \times 20 \times (10+4) \times 60 = 8400
E: \dfrac{1}{2} \times 20 \times 10 \times 60 = 6000
Total: 10800 + 7200 + 4800 + 8400 + 6000 = 37200 m.
Question 3: [2 marks]
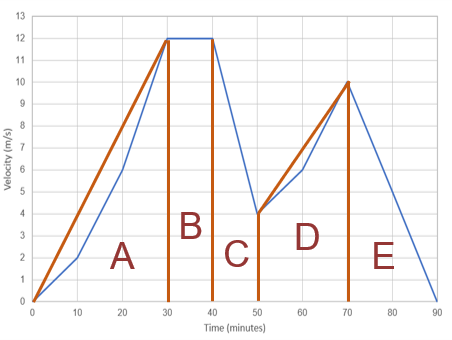
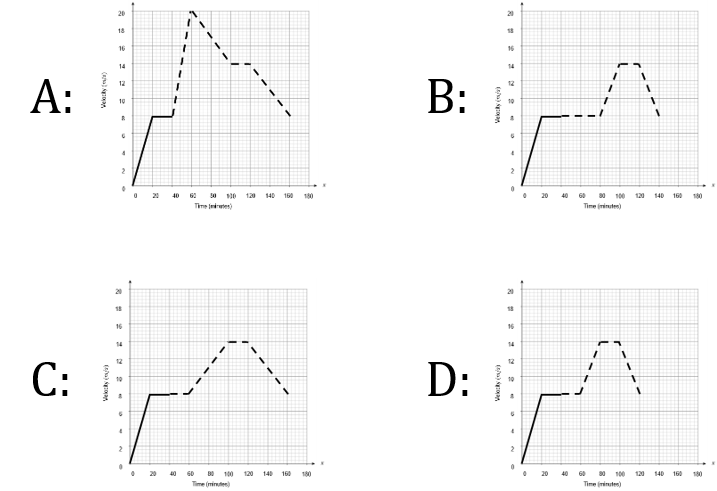
Here is the start of Celica’s journey, displayed on a velocity-time graph.
Using the information below, choose the correct completion for the velocity-time graph for Celica’s journey.
By the 60-minute mark, Celica has travelled 24 km in total.
After this she increases velocity at a constant rate, to 14 m/s, over 40 minutes.
She then maintains her velocity for 20 minutes before decelerating for 60 minutes at the same constant rate as her acceleration between 60 – 100 minutes.
Answer type: Multiple choice type 1
A: A
B: B
C: C
D: D
ANSWER: C: C
WORKING:
Distance covered in the first 40 minutes:
\dfrac{1}{2} \times 20 \times 60 \times 8 = 4800 m
20 \times 60 \times 8 = 9600 m
Total: 4800 + 9600 = 14400 m
Velocity during 40 – 60 minutes:
24000 - 14400=9600 m
9600 \div (20 \times 60) = 8 m/s
Question 4:
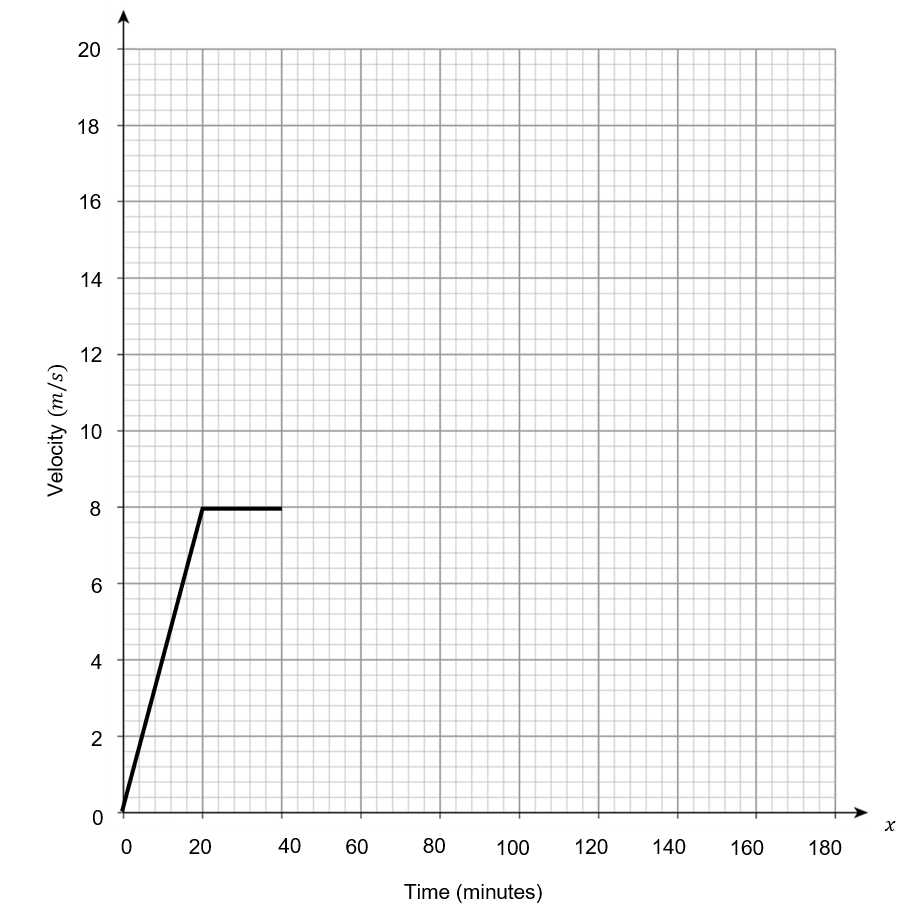
Diane goes out cycling for a 150-minute journey.
Her progress is displayed in the velocity-time graph below.
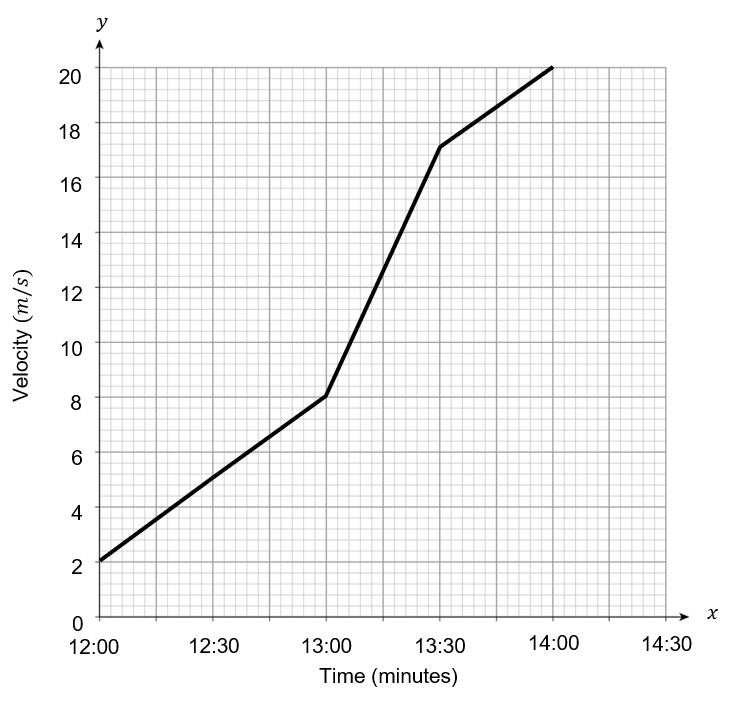
She looks at the graph and makes a calculation. She states,
“My acceleration from 12:00 to 13:30 was a constant 10 m/s^2”.
Question 4(a): [1 mark]
What is wrong with her statement? Choose the correct option.
Answer type: Multiple choice type 1
A: She calculated the deceleration.
B: She used the wrong numbers.
C: She calculated the average acceleration.
D: Her statement is in fact correct.
ANSWER: C: She calculated the average acceleration.
WORKING:
The actual acceleration is not constant.
Diane looks again at her velocity-time graph and makes a calculation of the distance she covered.
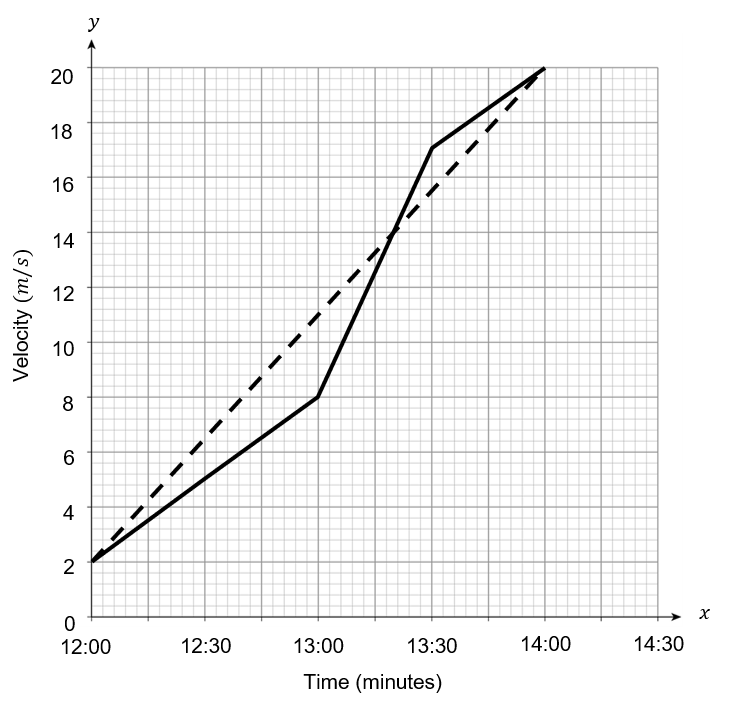
She calculates the distance covered using the dashed line to estimate her change in velocity between 12:00 and 14:00.
She states, “I rested from 14:00 to 14:30, so I can estimate the total distance covered on my journey by using the area of a trapezium”
\text{Distance } = \dfrac{2(2+20)}{2} = 22 \text{ miles}
Question 4(b): [1 mark]
Her estimate is incorrect. What is the correct estimate for her distance covered?
Answer type: Simple text answer
ANSWER: 32 miles
WORKING:
22 + \dfrac{20}{2} = 32 miles
Question 4(c): [1 mark]
Is your estimate and underestimate or overestimate?
Answer type: Multiple choice type 1
A: Underestimate
B: Overestimate
ANSWER: B: Overestimate
WORKING:
More of the curve is below the line used for the estimate.
Question 5:
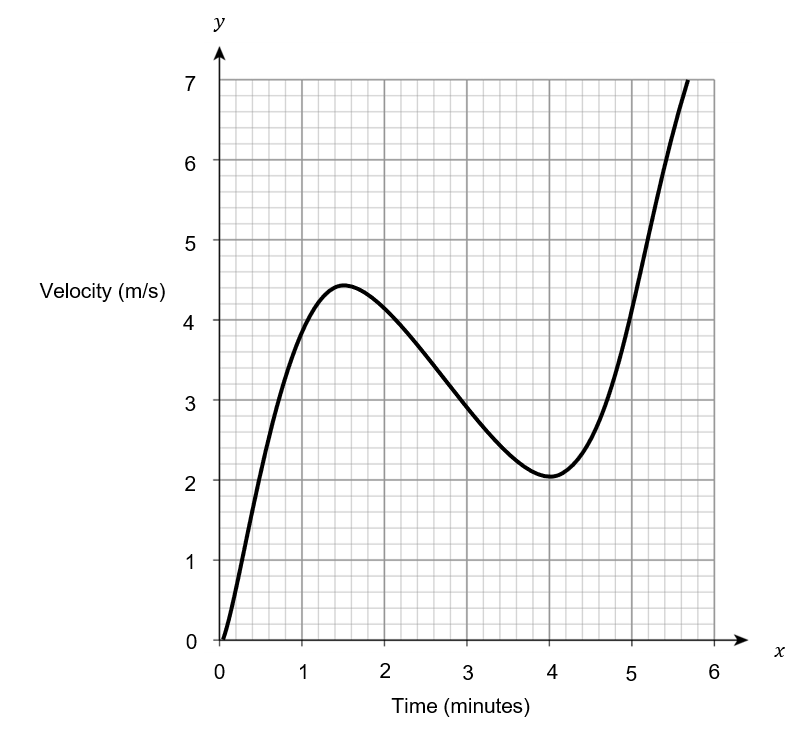
The following is a velocity time graph over the course of 6 minutes.
Question 5(a): [2 marks]
Estimate the distance covered in the first 4 minutes.
Choose the best estimation.
Answer type: Multiple choice type 1
A: 690 m
B: 310 m
C: 190 m
D: 950 m
ANSWER: A: 690 m
WORKING:
Split up into a triangle, call it A, of width 1.5 and height 4.5, and a trapezium, call it B, of lengths 2 and 4.5 and height 2.
Then calculate the areas, where minutes needs to be converted to seconds by multiplying by 60, and add them together.
A: \dfrac{1}{2} \times 1.5 \times 4.5 \times 60 = 202.5 m
B: \dfrac{1}{2} \times (2+4.5) \times 2.5 \times 60 = 487.5 m
Total: 202.5 + 487.5 = 690 m
Question 5(b): [1 mark]
Is this estimate an overestimate or underestimate.
Answer type: Multiple choice type 1
A: Overestimate
B: Underestimate
ANSWER: B: Underestimate
WORKING:
Underestimate as more of the curve is above the line used for the estimate.
Question 6:
Erika takes a bike ride, first travelling to the shops, arriving at 16:30, then travelling to a friend’s house to arriving at 19:00.
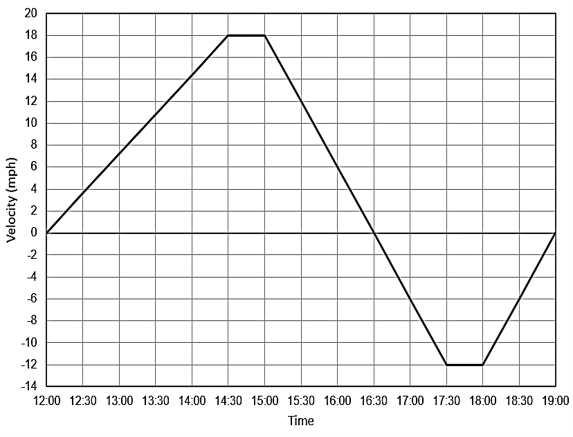
Question 6(a): [1 mark]
What does the velocity from 16:30 onwards represent?
Answer type: Multiple choice type 1
A: Acceleration
B: Deceleration
C: Constant speed
D: Travel in the other direction
ANSWER: D: Travel in the other direction
Question 6(b): [3 marks]
Calculate the overall distance travelled by Erika.
Answer type: Simple text answer
ANSWER: 63 miles
WORKING:
A: \dfrac{1}{2}(0.5+4.5)\times 18 = 45 miles
B: \dfrac{1}{2}(0.5 + 2.5) \times 12 = 18 miles
Total: 45 + 18 = 63 miles
Question 6(c): [1 mark]
Choose the correct statement regarding the difference between your answer and the distance between Erika and her friend’s house.
Answer type: Multiple choice type 2
A: It will be the same.
B: It will be shorter due to travel in other direction.
C: It will be longer due to travel in other direction.
ANSWER: B: It will be shorter due to travel in other direction.