Question 1:
Consider the sets following sets.
1(a) Which of the following Venn diagrams are correctly labelled with X’s in the regions that represent A\cap (B\cup C)?
ANSWER: Multiple Choice
A: 
B:
C:
D:
Answer: A
Workings:
A\cap (B\cup C) means the area in A that is also within either B or C.
Marks = 1
1(b) Which of the following Venn diagrams are correctly labelled with X’s in the regions that represent P‘ \cup Q \cup R?
ANSWER: Multiple Choice
A:
B:
C:
D:
Answer: A
Workings:
P‘ \cup Q \cup R means the area in Q or R or not in P. The area outside the circles is included in P‘.
Marks = 1
1(c) Which of the following Venn diagrams are correctly labelled with X’s in the regions that represent X \cap Y‘ \cap Z?
ANSWER: Multiple Choice
A:
B:
C:
D:
Answer: A
Workings:
X \cap Y‘ \cap Z is the region that is in X and Z and not in Y.
Marks = 1
Question 2
There are two sets displayed in the Venn diagram below.
(IMAGE MISSING HERE)
There are 64 items in the universal set, \xi
2(a) Find the value of x.
ANSWER: Simple
Answer: 7
Workings:
x+6+2x+3x+12+4=64
6x=42
x=7
Marks = 2
2(b) Find \text{P(A)}.
Give your answer as a fraction in its simplest form.
ANSWER: Fraction
Answer: \dfrac{27}{64}
Workings:
\text{P(A)}=\dfrac{x+6+2x}{64}=\dfrac{7+6+14}{64}=\dfrac{27}{64}
Marks = 1
Question 3
Consider the following Venn diagrams.
3(a) Which of the following regions, marked with X‘s, corresponds to the region X\cap Y \cap Z
ANSWER: Multiple Choice
A:
B:
C:
D:
Answer: A
Workings:
X\cap Y \cap Z is the region in X, Y and Z, i.e. the intersection of the circles.
Marks = 1
3(b) Which of the following shaded regions corresponds to Y \cap Z‘?
ANSWER: Multiple Choice
A: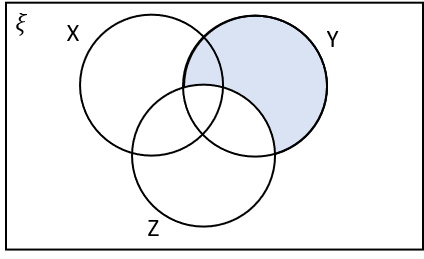
B: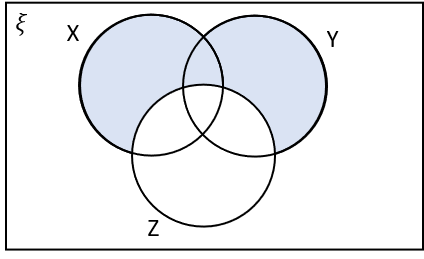
C: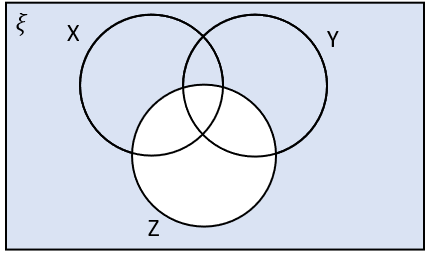
D: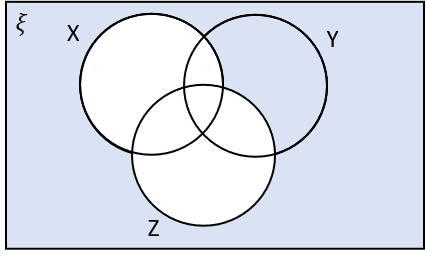
Answer: A
Workings:
Y \cap Z‘ is the region within Y that is not in Z.
Marks = 1
3(c) Which of the following shaded regions corresponds to X\cup Z \cap Y‘?
ANSWER: Multiple Choice
A: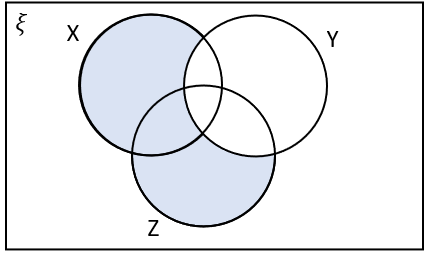
B: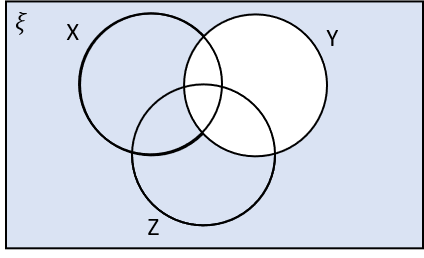
C: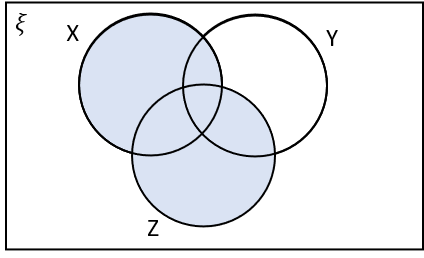
D: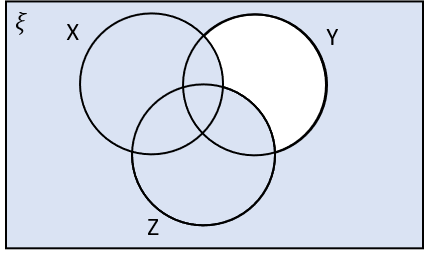
Answer:
A
Workings:
X\cup Z \cap Y‘ is the region in X or Z that is not in Y.
Marks = 1
Question 4:
A travel company looks to record data on holidays taken.
Out of 200 people surveyed, 30\% stayed in the UK for their holiday.
60\% of people went abroad.
10\% of people had two holidays, one abroad and one in the UK.
Select the correct Venn diagram using the information provided.
ANSWER: Multiple Choice
A:
B:
C:
D:
Answer: A
Workings:
30\% of 200: 0.3\times200=60. So 60 people in total had a holiday in the UK.
60\% of 200: 0.6\times200=120. So 120 people in total had a holiday abroad.
10\% of 200: 0.1\times200=20. So 20 people had a holiday abroad and a holiday in the UK. These people belong in the intersection.
There are a total of 200 people in the survey, so 200-120-60=20 people did not go on holiday.
Marks = 3
Question 5:
Given the following information:
A group of 102 parents were asked questions on a survey.
40 went to university.
58 did not attend university but have a job.
24 went to university and have a job.
Select the correct Venn diagram.
ANSWER: Multiple Choice
A:
B:
C:
D:
Answer: A
Workings:
Number at university without a job: 40-24=16.
Number who did not go to university and do not have a job: 102-24-16-58=4.
Marks = 3
Question 6:
Given the information below
\xi=\{43, 45, 58, 59, 62, 66, 68, 87\}P= Multiples of 3.
Q'=\{58,62,66,68\}Select the correct Venn diagram.
ANSWER: Multiple Choice
A:
B:
C:
D:
Answer: A
Workings:
Multiples of 3 in the universal set, \xi are 45,66,87
Q' are the numbers in the universal set, \xi, which are not in Q.
This is enough information to complete the diagram.
Marks = 3
Question 7
100 students were asked whether they liked Hockey, Tennis or Football.
6 students liked all three sports
24 students liked Hockey and Tennis
29 students liked Football and Hockey
20 students liked Football and Tennis
59 students like Hockey
17 students like only Football
4 students like none of the three sports
7(a) Select the correct Venn diagram to represent the above information.
ANSWER: Multiple Choice
A: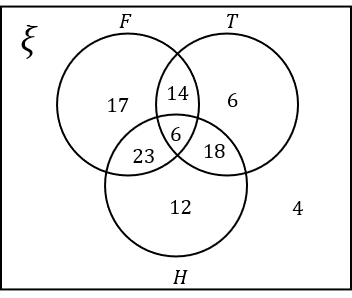
B: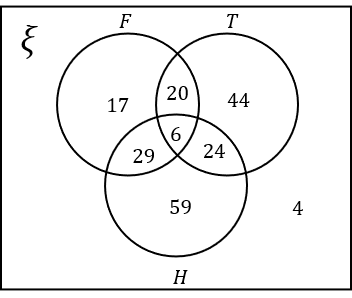
C: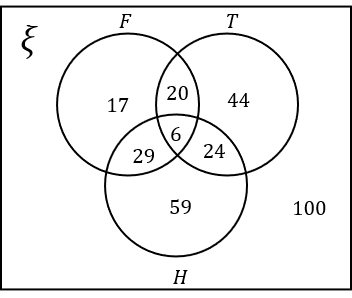
D: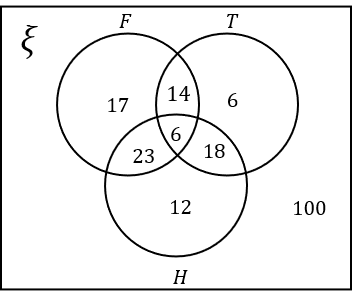
Answer: A
Workings:
Hockey:
59 students in total like Hockey.
6 of these students like all three sports.
24 of these students like Hockey and Tennis. So the number of students that like Hockey and Tennis only is 24-6=18.
29 of these students like Hockey and Football. So the number of students that like Hockey and Football only is 29-6=23.
The number of students that like Hockey only is 59-6-18-23=12.
Football:
17 students like Football only and 20 students like both Football and Tennis.
Of the 20 that like Football and Tennis, 6 also like Hockey. So the number of students that like Football and Tennis only is 20-6=14.
Tennis:
There are 4 students that don’t like any sport. The number of students that like Tennis only is therefore 100-59-17-14-4=6
This is all the information required to complete the Venn diagram.
Marks = 3
7(b) What is the probability that a student liked only Tennis?
Give your answer as a fraction in its simplest form.
ANSWER: Fraction
Answer: \dfrac{3}{50}
Workings:
Number of students that like Tennis only =6
Hence, \text{P(Tennis only)}=\dfrac{6}{100}=\dfrac{3}{50}
Marks = 1
7(c) What is the probability a student liked exactly two sports?
Give your answer as a fraction in its simplest form.
ANSWER: Fraction
Answer: \dfrac{11}{20}
Workings:
Number of students that like exactly 2 sports =23+18+14=55
Hence, \text{P(two sports exactly)}=\dfrac{55}{100}=\dfrac{11}{20}
Marks = 1
Question 8
Given the following information:
\xi=\text{\{factors of 140\}}
A=\text{\{prime numbers\}}
B=\text{\{multiples of 5\}}
Select the correct Venn Diagram.
ANSWER: Multiple Choice
A:
B:
C:
D:
Answer: A
Workings:
\xi is the factors of 140 which are:
1, 140
2, 70
4, 35
5, 28
10, 14
7, 20
The prime numbers within \xi are 2, 5, 7. Remember, 1 is not a prime number.
The multiples of 5 with \xi are 5, 10, 20, 35, 70, 140.
Hence the only number in the intersection is 5, and the numbers 1, 4, 14 remain outside the two circles.
Marks = 4
Question 9:
Given the information below
\xi= \text{\{Integers from 1 to 10\}}
A= \text{\{Square numbers\}}
B= \text{\{Prime numbers\}}
C= \text{\{1,2,3,5,8\}}
8(a) Select the correct Venn diagram.
ANSWER: Multiple Choice
A:
B:
C: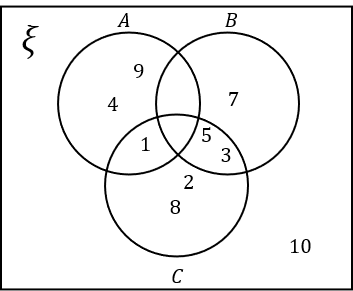
D: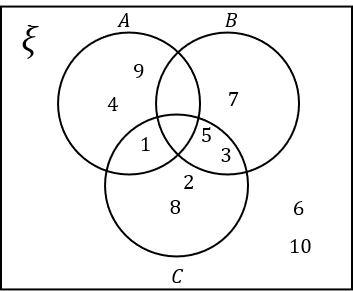
Answer: B
Workings:
\xi= \text{\{Integers from 1 to 10\}}=\{1,2,3,4,5,6,7,8,9,10\}
A= \text{\{Square numbers\}}=\{1,4,9\}
B= \text{\{Prime numbers\}}=\{2,3,5,7\}. Remember 1 is not a prime number.
C= \text{\{1,2,3,5,8\}}
Marks = 3
9(b) Calculate the probability of a number in set C, given you are selecting a prime number.
Give your answer as a fraction in its simplest form.
ANSWER: Fraction
Answer: \dfrac{2}{5}
Workings:
5 numbers are prime
2 of the numbers in set C are prime.
Answer \dfrac{2}{5}
Marks = 1