Question 1
Here are the number of pizzas a takeaway sold each day for the past 7 days.

The sales are displayed in the pictograph below.
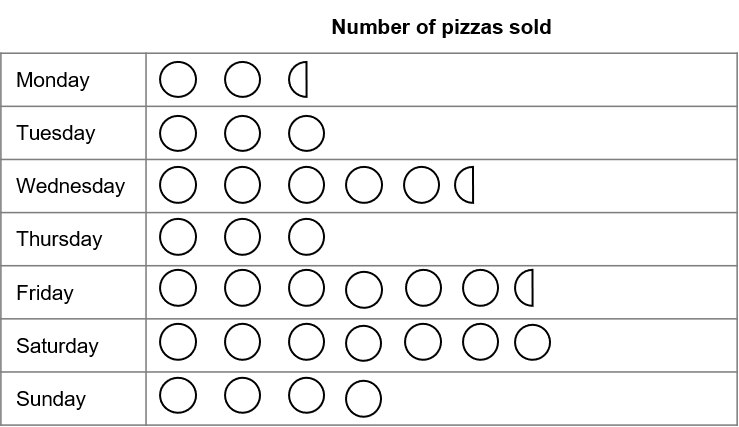
1(a) How many pizzas does 1 circle represent?
ANSWER: Simple
Answer: 10
Workings:
Looking at the data for Monday, there are 25 pizzas sold, represented by 2.5 circles so 1 circle is 10 pizzas.
Marks = 1
1(b) How many pizzas were sold altogether?
ANSWER: Simple
Answer: 315
Workings:
There 31.5 circles in total so the number of pizzas sold is 31.5\times10=315.
Marks = 1
Question 2:
The pictograph below shows the number of hours of sunshine on 1^{\text{st}} April in 5 cities.

2(a) Which city had the least sunshine?
ANSWER: Multiple choice
A: London
B: New York
C: Paris
D: Barcelona
E: Rome
Answer: A
Marks = 1
Workings:
Count which city has the least number star shapes next to it.
2(b) How many hours of sunshine did Paris have?
ANSWER: Simple
Answer: 7
Workings:
3.5\times2=7 hours
Marks = 1
2(c) How many more hours of sunshine did New York have compared to Barcelona?
ANSWER: Simple
Answer: 5 hours
Workings:
Hours of sunshine in New York: 5\times2=10
Hours of sunshine in Barcelona: 2.5\times2=5
Difference: 10-5=5
Marks = 2
Question 3:
Students in a year 7 class were asked to choose their favourite colour.
The results are shown in the pictograph below.

3(a) How many pupils are in the class?
ANSWER: Simple
Answer: 34
Workings:
There are 8.5 circles in total, so the number of pupils is 8.5\times4=34
Marks = 1
3(b) What is the modal colour?
ANSWER: Multiple choice
A: Red
B: Blue
C: Green
D: Yellow
E: Purple
Answer: A
Workings:
Red was the most common answer so it is the mode.
Marks = 1
3(c) How many more pupils said red compared to green?
ANSWER: Simple
Answer: 3
Workings:
Number of students that said red: 2.5\times4=10
Number of students that said green: 1.75\times4=7
Difference =10-7=3
Marks = 1
Question 4:
Pupils in a class were asked how they got to school.
The results are shown in the pictograph below.

4(a) How many pupils take the bus to school?
ANSWER: Simple
Answer: 5
Workings:
1.25\times4=5Marks = 1
4(b) What is the mode?
ANSWER: Multiple choice
A: Walk
B: Cycle
C: Car
D: Bus
E: Train
Answer: A
Workings:
Walking is the most common response
Marks = 1
4(c) A few weeks later, one pupil moved house and could no longer walk to school. They now travel by car.
What effect does this have on the mode from part (b)?
ANSWER: Multiple choice
A: The mode would not change
B: The mode would change
C: There are now 2 modal values
D: There is now no modal value
Answer: A
Workings:
Before the students moved, 10 pupils walked to school and 7 arrived by car.
After the student has moved, 9 pupils walk to school and 8 arrive by car, so walking is still the most common method of transport.
Marks = 1
Question 5
The colours of smarties in a bag were recorded and shown in the pictograph below.

5(a) 12 of the smarties were orange.
How many smarties does one symbol represent?
ANSWER: Simple
Answer: 3
Workings:
There are 4 symbols representing 12 orange smarties, so each symbol is 12\div4=3 smarties.
Marks = 1
5(b) 9 smarties were brown.
How many symbols should be added to the pictograph to show this information?
ANSWER: Simple
Answer: 3
Workings:
9\div3=3 So 3 symbols should be added.
Marks = 1
5(c) What percentage of the smarties were pink?
ANSWER: Simple
Answer: 5%
Workings:
Number of pink smarties =3
Total number of smarties =20\times3=60
Percentage =\bigg(\dfrac{3}{60}\bigg)\times100=5\%
Marks = 1
Question 6:
Tom and Jerry counted the number of cars that passed each of their houses, each morning for the same 5 days.
The pictographs below show their results.
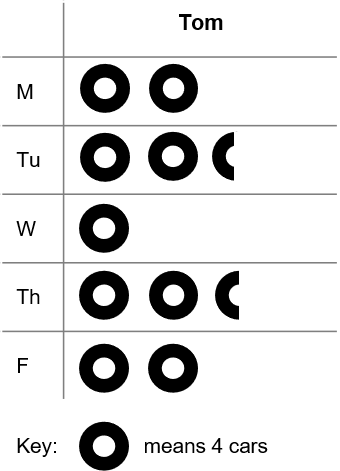
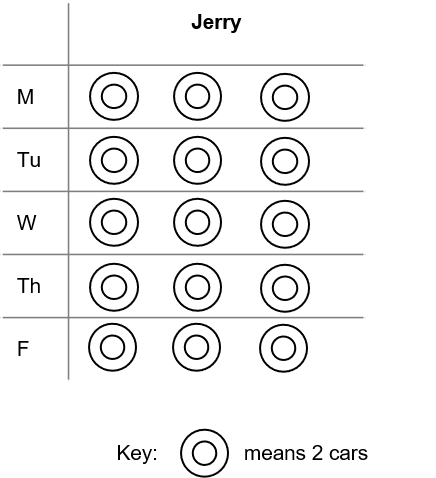
Who saw the most cars over the 5 days?
ANSWER: Multiple choice
A: Tom
B: Jerry
C: They both saw the same amount of cars
Answer: Tom
Workings:
Tom:
Total number of symbols =10
Total number of cars =10\times4=40
Jerry:
Total number of symbols =15
Total number of cars =15\times2=30
Therefore Tom saw more cars during the week.