Question 1:
Pete measured how late his school bus was over the course of 6 months.
The results are summarised in the table below.
Question 1(a): [2 marks]
Use the information to find the values of a, b, c, d, e, and f from the table below.

Answer type: Multiple answers type 1
ANSWER:
a = 6
b = 19
c = 53
d = 72
e = 85
f = 90
Question 1(b): [2 marks]
Pete wants to plot the information shown in the table to make a cumulative frequency diagram.
Starting with the smallest x value, find the first two coordinates Pete will plot.
Choose the correct answer.
Answer type: Multiple choice type 1
A: (2, 6) and (4, 19)
B: (0,6) and (2,13)
C: (6,2) and (19,4)
D: (6,0) and (13,2)
ANSWER: A: (2, 6) and (4, 19)
WORKING:
x-coordinate is the highest value of the respective group and the y-coordinate is the cumulative frequency found in part (a)
Question 2: [2 marks]
Oliver picks 90 apples from the apple trees in his garden and weighs them individually.
The weights have been summarised in the cumulative frequency table below.

Choose the correct plot of the cumulative frequency graph using this information.
Answer type: Multiple choice type 1
A: 
B: 
C: 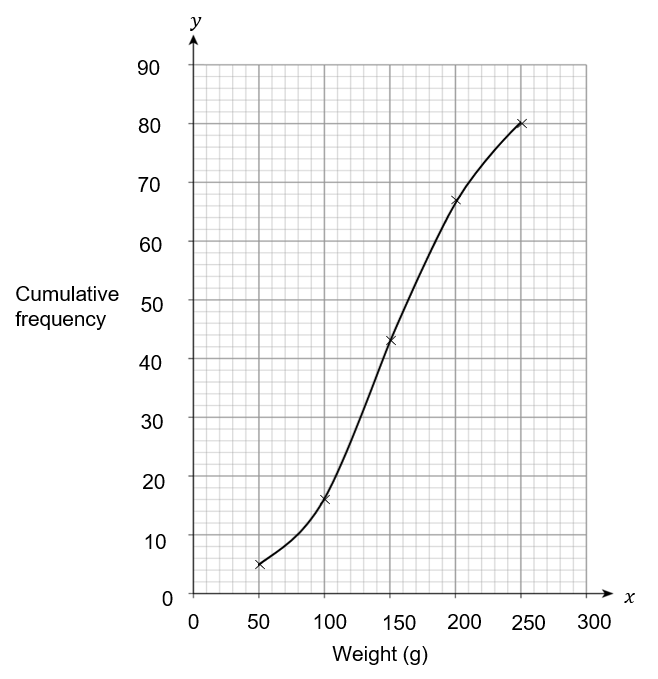
D: 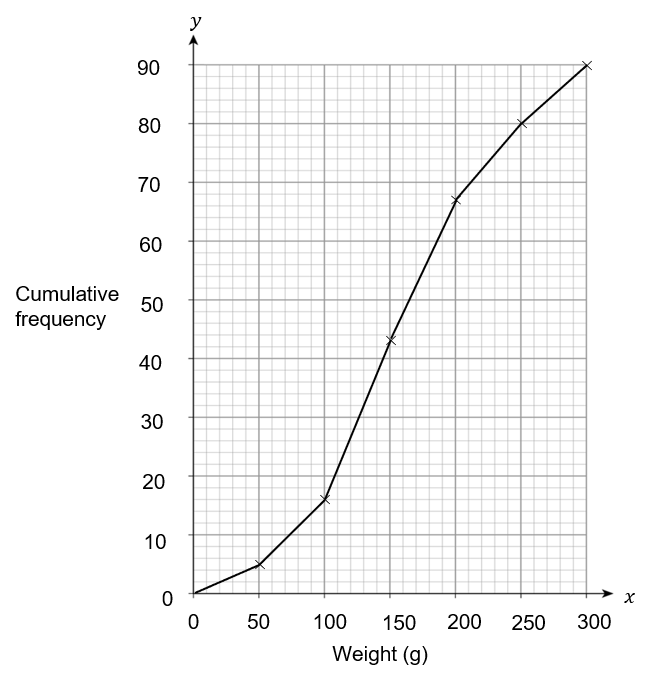
ANSWER: A
WORKING:
Needs to be a smooth curve passing through the correct points, starting from 0.
Question 3:
Connor does a survey on how much money 100 people spend over the Christmas period.
The results have been plotted on a cumulative frequency diagram below.
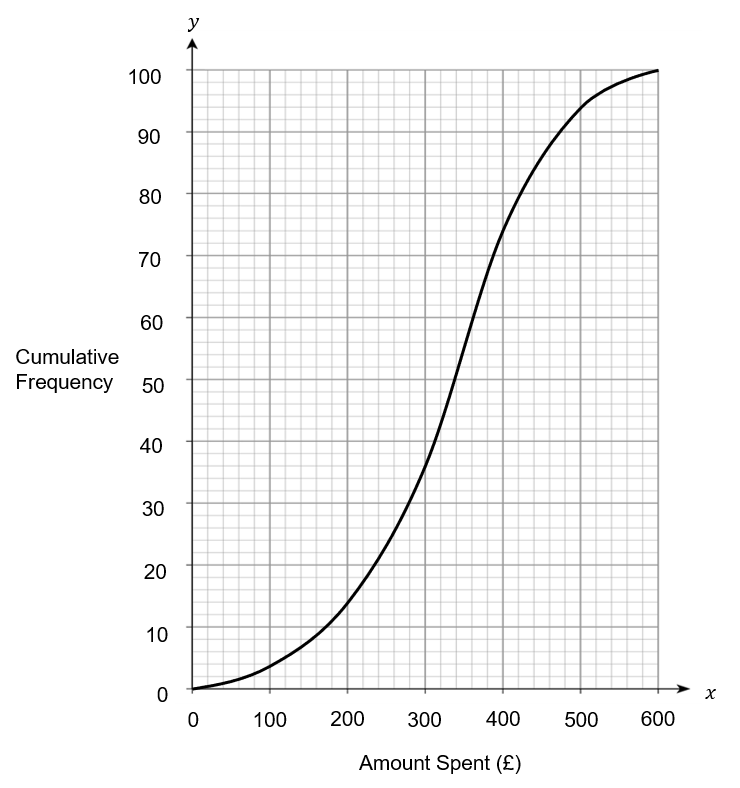
Question 3(a): [1 mark]
Use the cumulative frequency diagram to find the median amount spent.
Give your answer to the nearest £10.
Answer type: Simple text answer
ANSWER: £340
WORKING:
Go across from 50 on the y axis until you meet the graph, then go down until you meet the x axis.
This is the median, which is £340 to the nearest £10.
Question 3(b): [1 mark]
Use the cumulative frequency diagram above to find the lower quartile.
Give your answer to the nearest £10.
Answer type: Simple text answer
ANSWER: £260
WORKING:
Go across from 25 on the y axis until you meet the graph, then go down until you meet the x axis.
This is the lower quartile, which is £260 to the nearest £10.
Question 3(c): [1 mark]
Use the cumulative frequency diagram above to find the upper quartile.
Give your answer to the nearest £10.
Answer type: Simple text answer
ANSWER: £400
WORKING:
Go across from 75 on the y axis until you meet the graph, then go down until you meet the x axis.
This is the upper quartile, which is £400 to the nearest £10.
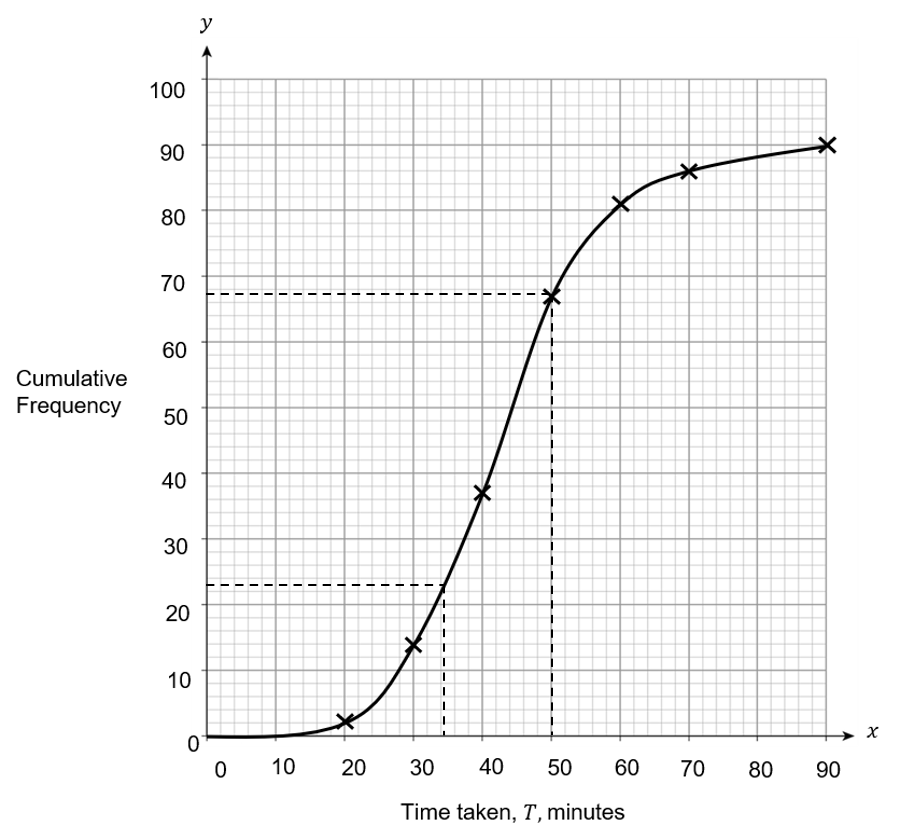
Question 3(d): [1 mark]
Use the cumulative frequency diagram above and your answers to part b) and c) to find the inter-quartile range.
Give your answer to the nearest £10.
Answer type: Simple text answer
ANSWER: £140
WORKING:
\text{inter-quartile range} = \text{upper quartile} - \text{lower quartile} = 400 - 260 = £140
Question 3(e): [1 mark]
Use the cumulative frequency diagram to estimate the number of people who spent over £500 during the Christmas period.
Answer type: Simple text answer
ANSWER: 6
WORKING:
Go up from £500 on the x axis until you meet the graph.
Then go across until you meet the y axis. This meets at 94.
Therefore there are 100 - 94 = 6 people who spent over £500 during the Christmas period.
Question 4:
Debbie collects data on the time it takes people in her year group to complete a cross-country race.
The completion times have been summarised in the grouped frequency table below.

Question 4(a): [2 marks]
Use the information in the table to choose the correct plot of a cumulative frequency diagram below.
Answer type: Multiple choice type 1
A: 
B: 
C: 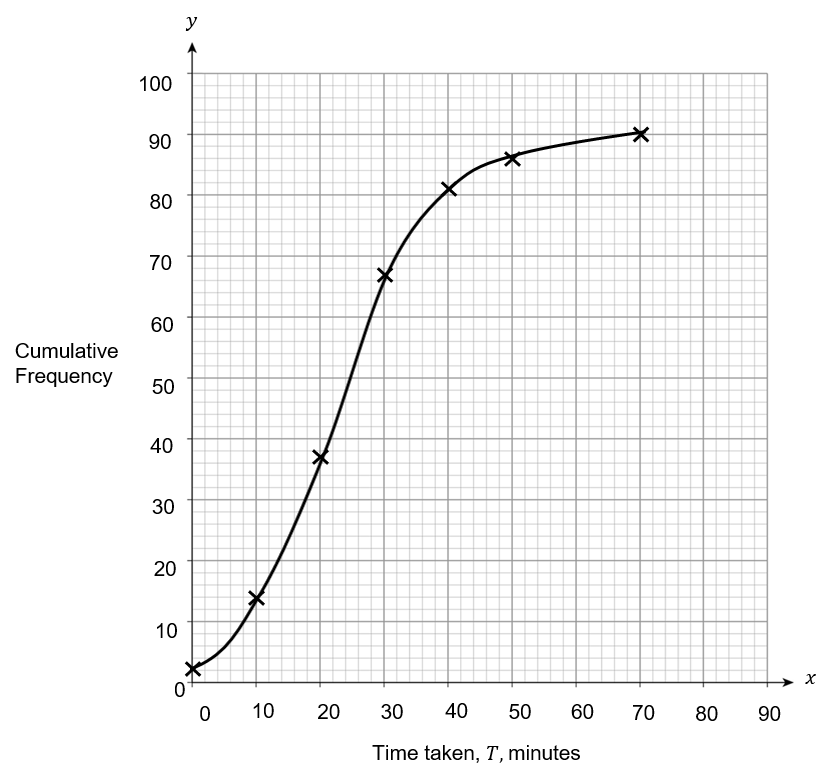
D: 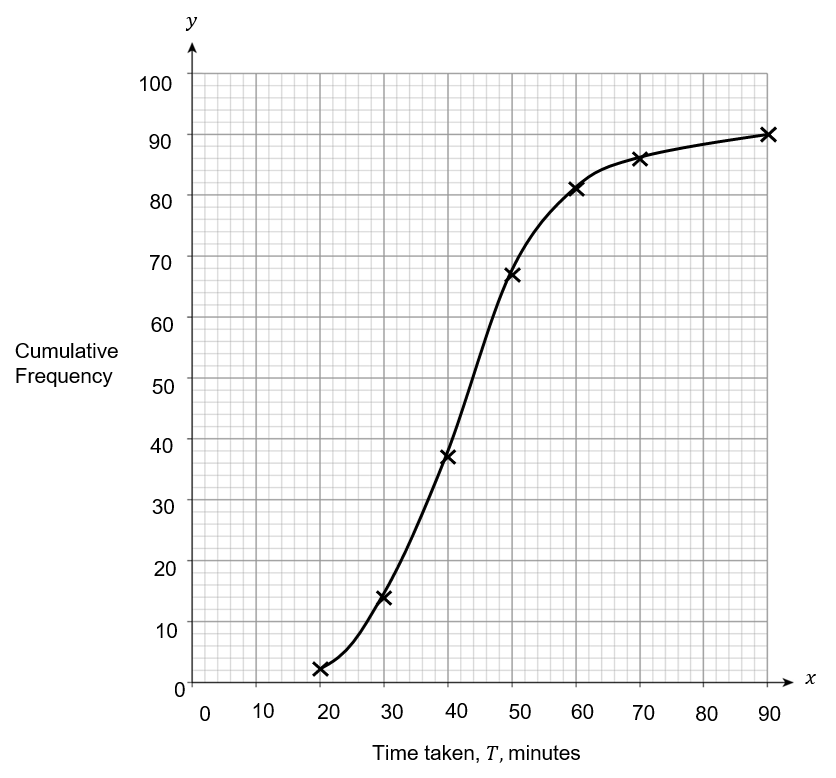
ANSWER: A
WORKING:
Needs to be a smooth curve passing through the correct points, starting from 0.
Question 4(b): [2 marks]
Using the cumulative frequency diagram, calculate the inter-quartile range.
Choose the correct answer.
Answer type: Multiple choice type 1
A: 16
B: 50
C: 34
D: 84
ANSWER: A: 16
WORKING:
\text{Upper quartile} = 50
\text{Lower quartile} = 34
\text{Inter-quartile range} = 50 - 34 = 16
Question 4(c): [2 marks]
Using your cumulative frequency diagram, calculate an estimate for the number of people who completed the race in under 45 minutes.
Answer type: Simple text answer
ANSWER: 52
WORKING:
Go up from 45 minutes, until you meet the curve.
Then go across until you meet the y axis at 52.
Question 5:
Eve collects information on the household spending per day for 100 families.
The information has been summarised in the cumulative frequency diagram below.

Question 5(a): [2 marks]
How many families spend greater than £25, but lower than £45, per day?
Answer type: Multiple choice type 1
A: 52
B: 31
C: 83
D: 60
ANSWER: A: 52
WORKING:
The cumulative frequency for £45 is 83.
The cumulative frequency for £25 is 31.
So, we calculate the difference, which is 83-31 = 52.
Question 5(b): [1 mark]
Her friend Frances collected her own data.
The median for her data is £27.
Who’s median is greater?
Answer type: Multiple choice type 1
A: Eve
B: Frances
ANSWER: A: Eve
WORKING:
Eve’s median is £33.
Therefore Eve has the greatest median.
Question 6: [2 marks]
Graham collects data on the ages of people in his village.
He has summarised the information in a frequency table below.
He then plots his information on a cumulative frequency diagram as shown.
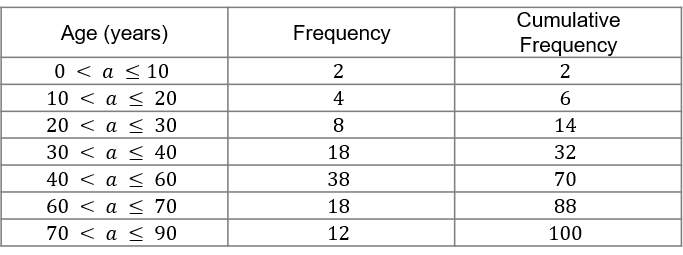
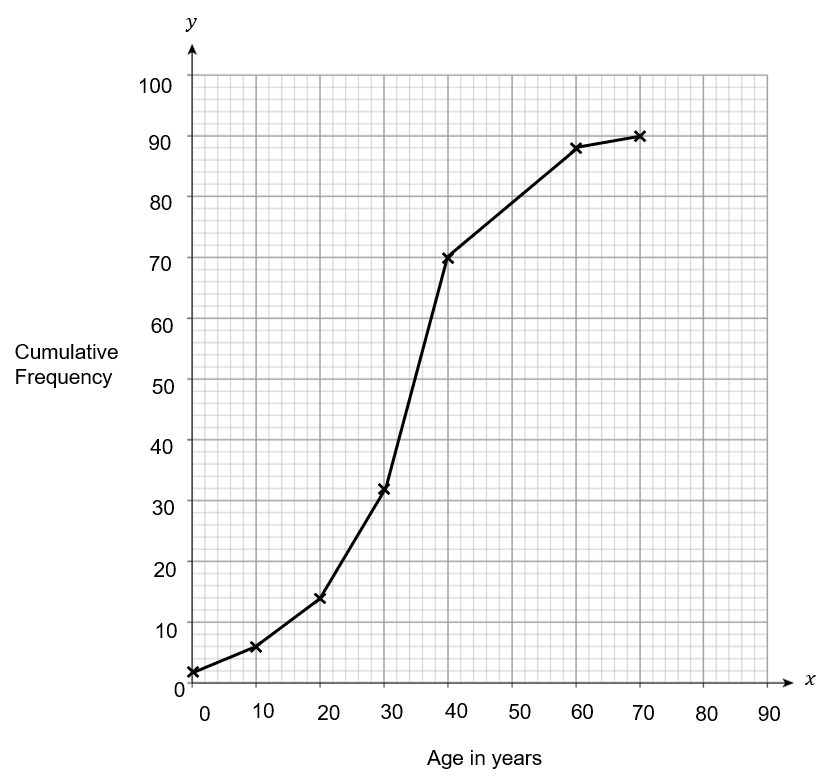
Graham made three mistakes when plotting his cumulative frequency graph.
Choose the correct answer from below, which identifies all three mistakes.
Answer type: Multiple choice type 2
A: He used straight lines to join the points rather than a smooth curve and plotted the data at the start of each interval instead of at the end and he only plotted the data up to 90 instead of 100.
B: He used straight lines to join the points rather than a smooth curve and plotted the data at the start of each interval instead of at the end and he labelled his y axis incorrectly.
C: He used straight lines to join the points rather than a smooth curve and he plotted the frequency instead of the cumulative frequency and he only plotted the data up to 90 instead of 100.
D: He plotted the frequency instead of the cumulative frequency and plotted the data at the start of each interval instead of at the end and he only plotted the data up to 90 instead of 100.
ANSWER: A