Question 1: [2 marks]
The table gives information about the heights of Year 12 pupils in college.

Choose the correct histogram drawn using the information in the table above.
Answer type: Multiple choice type 1
A: 
B: 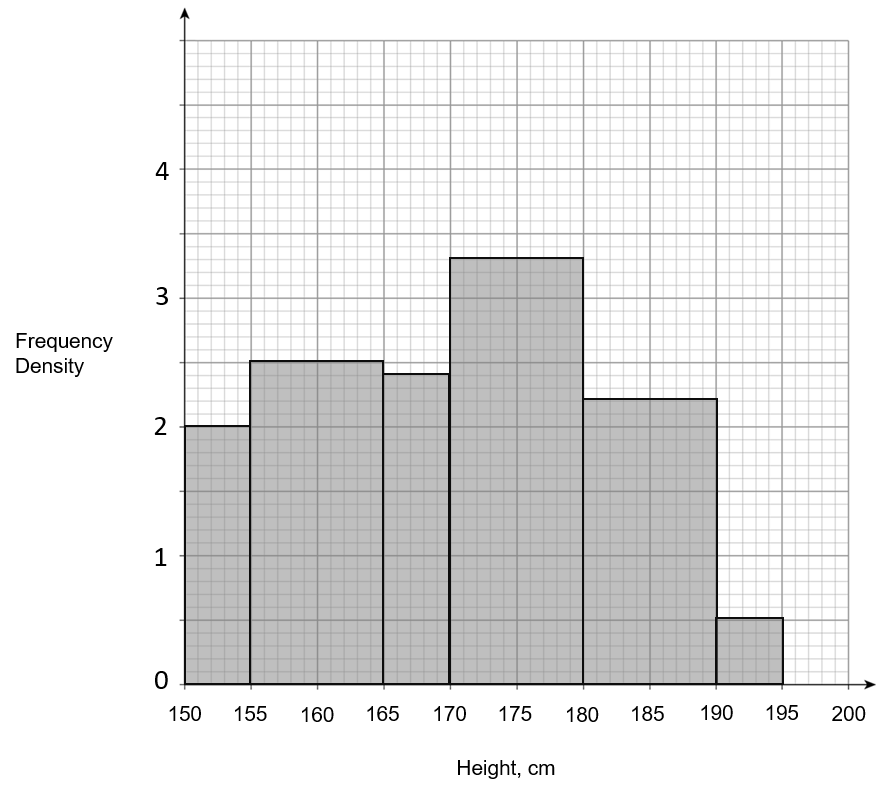
C: 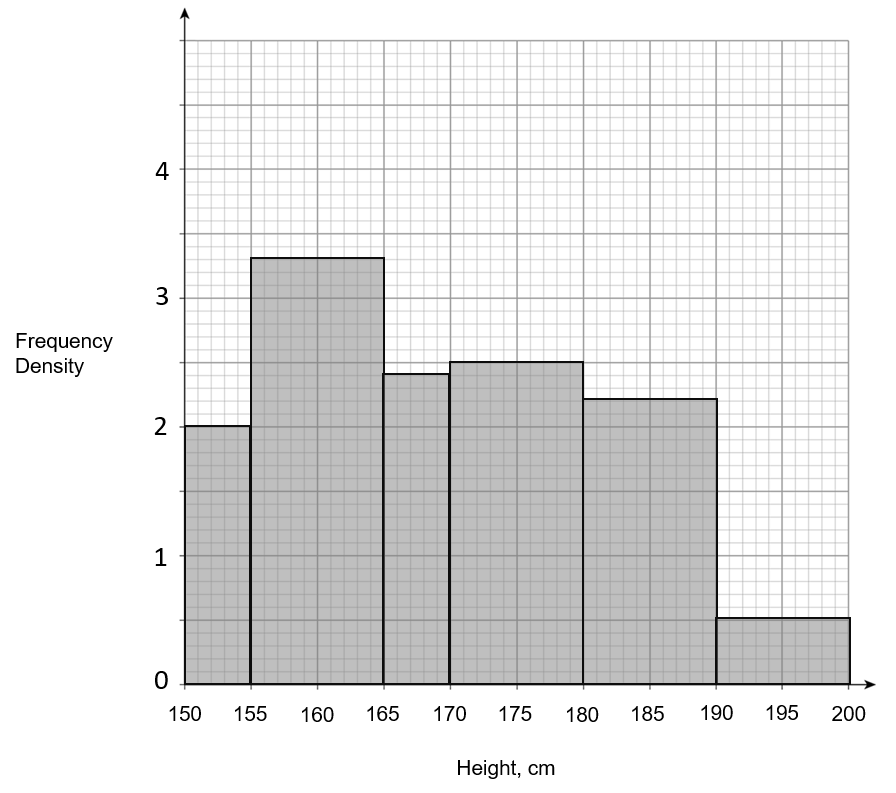
D: 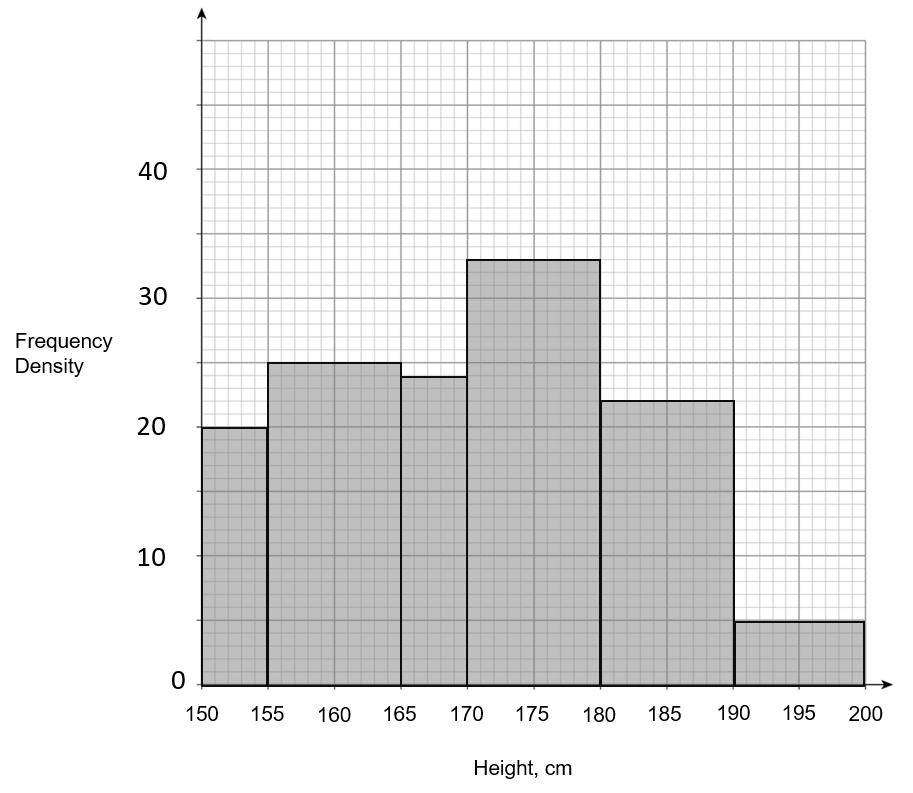
ANSWER: A
WORKING:

Question 2: [3 marks]
Data on the travel times of students getting to school has been collected and is summarised in a histogram below.
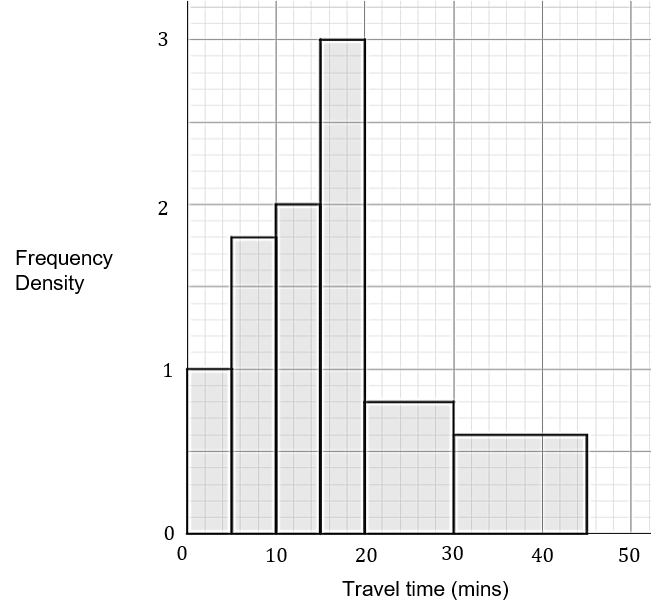
Use the histogram to find the values of a, b, c, d, e and f, in the grouped frequency table below.

Answer type: Multiple answers type 1
ANSWER:
a=5
b=9
c=10
d=15
e=8
f=9
WORKING:

Question 3:
The table shows the results of a spelling test.

Question 3(a): [2 marks]
Choose the correct histogram drawn using the information in the table above.
Answer type: Multiple choice type 1
A: 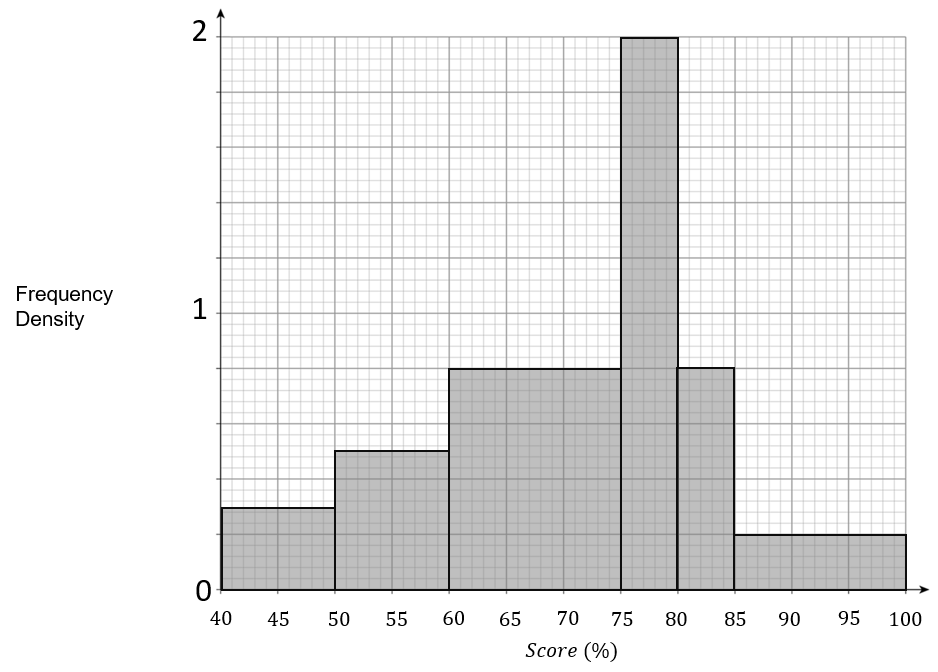
B: 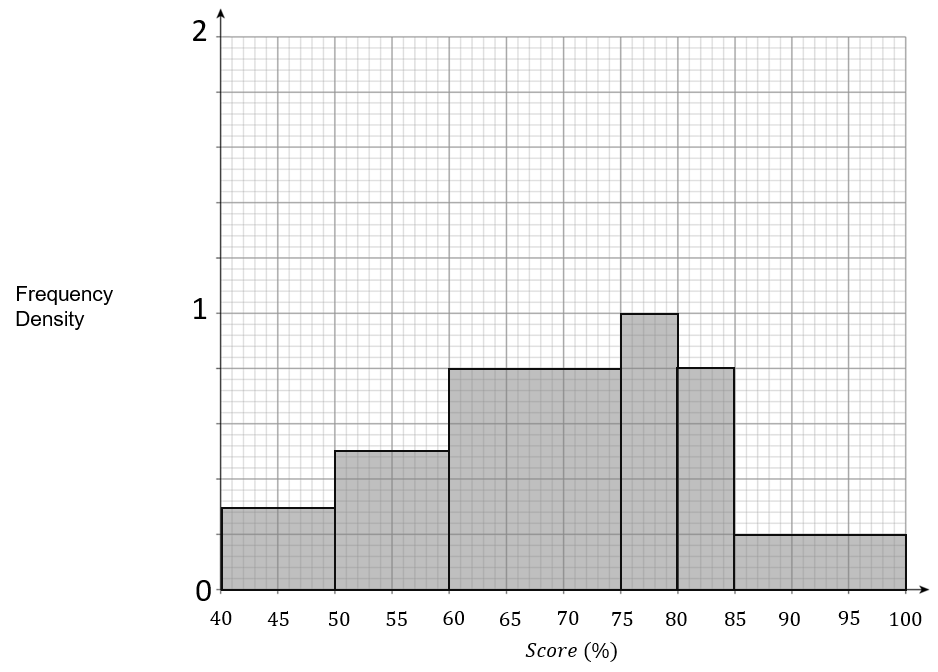
C: 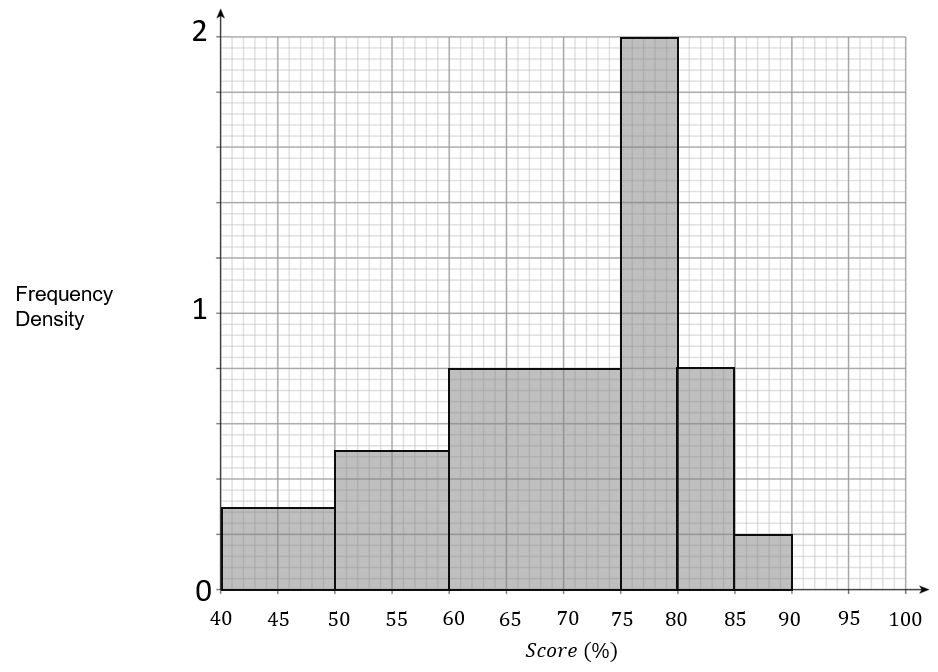
D: 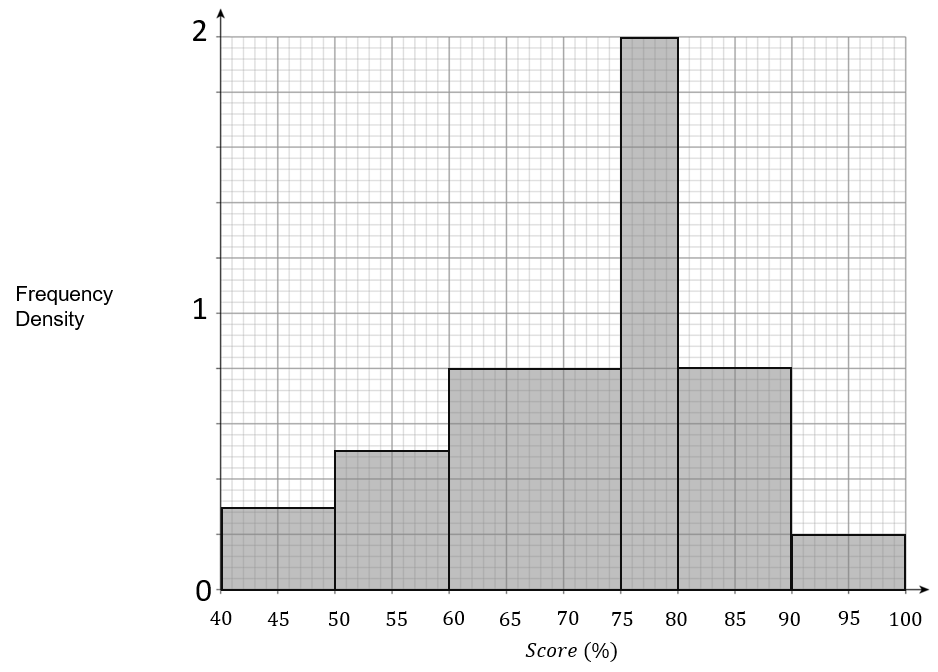
ANSWER: A
WORKING:

Question 3(b): [2 marks]
Calculate an estimate for the median score using the correct histogram and choose the closest answer.
Answer type: Multiple choice type 1
A: 73.75
B: 60
C: 61.25
D: 80.25
ANSWER: A: 73.75
WORKING:

The median is the \dfrac{37+1}{2} = 19 \text{th} number, which is in the 60 < m \leq 75.
The 19 \text{th} number is the 19-3-5 = 11 places out of 12 into this interval
Split the interval into even pieces by dividing the width by the frequency:
\dfrac{15}{12} = 1.25Find how far the number is into the interval by multiplying it by our previous answer.
11 \times 1.25 =13.75Add it to the lower end of the interval
60+13.75 = 73.75
Question 4:
The table and histogram show some data on the amount spent by shoppers during the Christmas period.

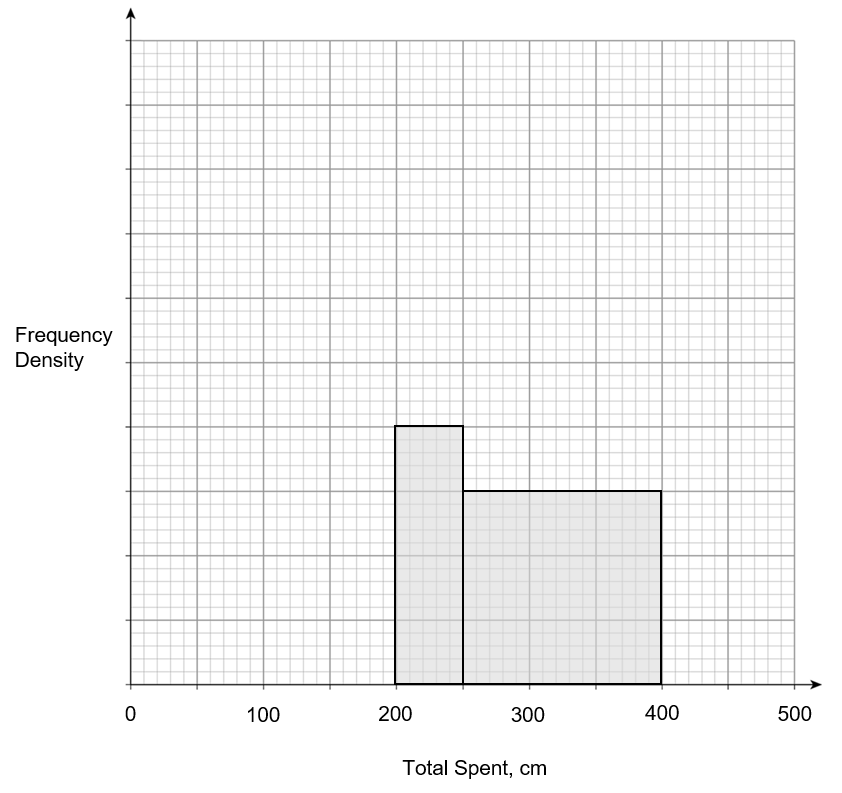
Question 4(a): [2 marks]
Choose the correct histogram drawn using the information above.
Answer type: Multiple choice type 1
A: 
B: 
C: 
D: 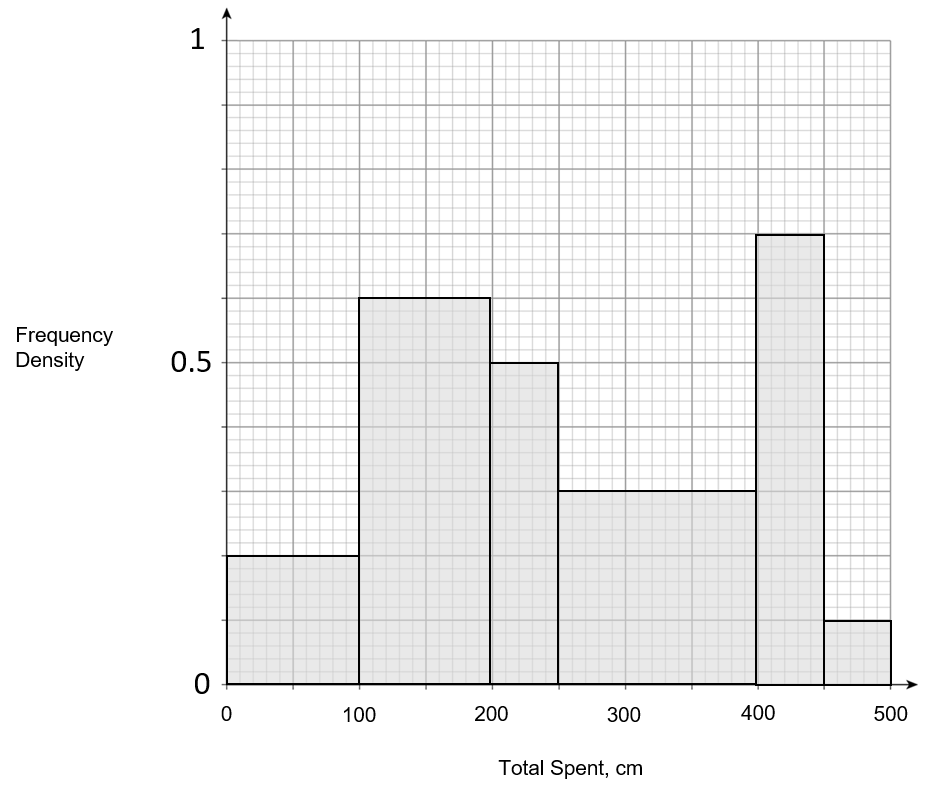
ANSWER: D
WORKING:

Question 4(b): [1 mark]
Find the value of x from the table above.
Answer type: Simple text answer
ANSWER: 45
WORKING:
150 \times 0.3 = 45
Question 5:
Use the histogram below to answer the following questions.
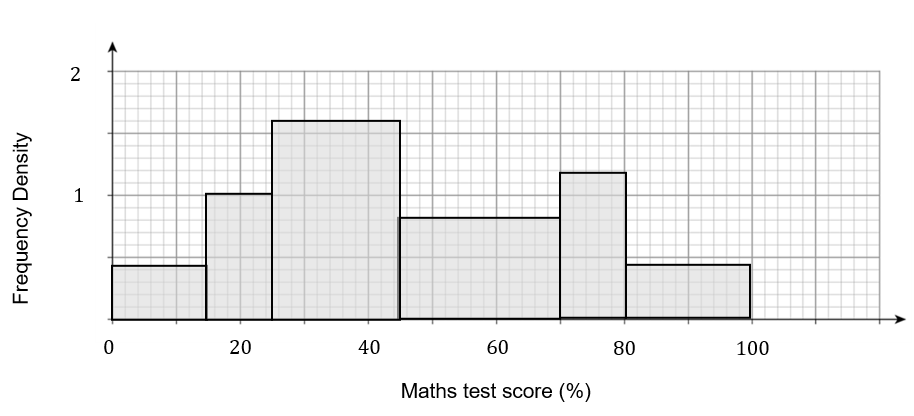
Question 5(a): [2 marks]
The score required for a grade C was 45\%.
How many students achieved at least a grade C?
Answer type: Simple text answer
ANSWER: 40
WORKING:
\text{Frequency} = \text{Frequency density} \times \text{Class width}Find the frequency for each of the final three bars and add them up.
(0.8 \times 25) + (1.2 \times 10) + (0.4 \times 20) = 20 + 12 + 8 = 40
Question 5(b): [2 marks]
Which group was the modal class?
Answer type: Multiple choice type 1
A: 0 < x \leq 15
B: 15 < x \leq 25
C: 25 < x \leq 45
D: 45 < x \leq 70
E: 70 < x \leq 80
ANSWER: C: 25 < x \leq 45
WORKING:
The modal class is the bar with the largest area, which is 25 < x \leq 45.
Question 5(c): [1 mark]
The score required for a grade B was 75\%.
Estimate the number of students that achieved a grade A or B assuming A is the highest grade.
Answer type: Simple text answer
ANSWER: 14
WORKING:
There are 12 \div 2 = 6 students in 70 < x \leq 80.
6+8=14 students achieved 75\% or more, so achieved a grade A or B.
Question 6:
The times taken for students to complete a challenge in PE are collected.
There are x students in the group 30 < t \leq 35.
y students join the group and the frequency density increases by 15\%.
Question 6(a): [3 marks]
Tom says, “there were fewer than 50 people in group x and y“.
Using this knowledge, find possible values for the number of students in x and y.
Answer type: Multiple choice type 1
A: x = 20 and y = 3 or x = 40 and y = 6
B: x = 20 and y = 6 or x = 40 and y = 3
C: x = 10 and y = 1.5 or x = 40 and y = 6
D: x = 20 and y = 3 or x = 10 and y = 1.5
ANSWER: A
WORKING:

We get frequency density (z) by dividing the frequency (x) by the width of the class interval.
z = \dfrac{x}{35-30} = \dfrac{x}{5}

Adding y students gives a new frequency of x+y, and increases the frequency density by 15\%.
1.15z = \dfrac{x+y}{5}Substitute z in from the equation above.
1.15 \times \dfrac{x}{5} = \dfrac{x+5}{5}
\dfrac{1.15x}{5} = \dfrac{x+y}{5}
1.15x = x+y
\dfrac{3}{20}x = y
We get two possible solutions for x and y that match the criteria:
x = 20 and y = 3 or x = 40 and y = 6
Question 6(b): [2 marks]
Based on your answer, make an estimate for the number of students who achieved a time between 30 < t \leq 32.
Answer type: Multiple choice type 1
A: 9 or 18 students
B: 8 or 19 students
C: 58 or 115 students
D: 6 or 12 students
ANSWER: A: 9 or 18 students
WORKING:
\dfrac{32-30}{35-30} = \dfrac{2}{5} = 0.4 = 40\%Hence, either (20+3) \times 0.4 \approx 9 students
or (40+6) \times 0.4 \approx 18 students
Question 7: [3 marks]
The histogram shows information about the time it took 266 people to commute to work.
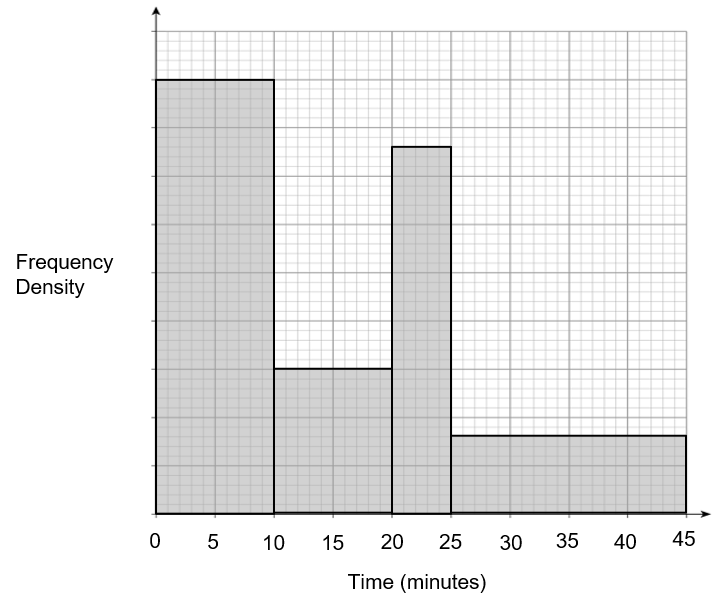
Any employee whose commute took 15 minutes or less, are able to sign up for a cycle-to-work scheme.
Use the histogram to estimate the percentage of people that are eligible for the scheme.
Give your answer to 1 decimal place.
Answer type: Simple text answer
ANSWER: 55.3
WORKING:
\text{Sum of area} = 18 + 6 + 7.6 + 6.4 = 38 big squares.
\dfrac{266}{38} = 7 people per big square.
There are 21 big squares before 15 minutes, which is 21 \times 7 = 147 people
Therefore the percentage of people that are eligible for the scheme is \dfrac{147}{266} = 55.3 \% (1 dp)