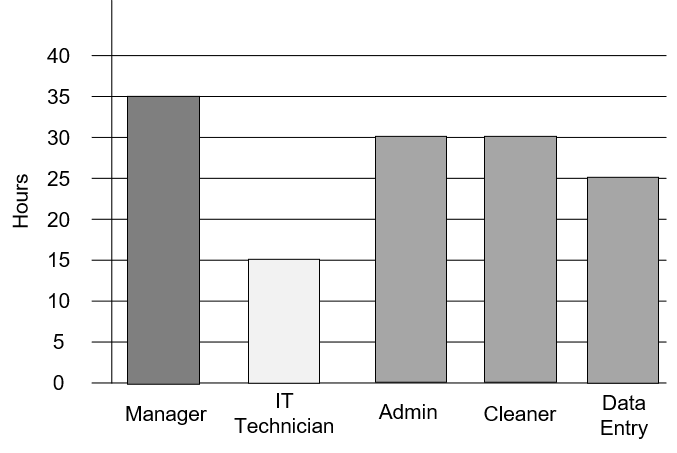
- In an office, the total number of weekly hours worked is 135.
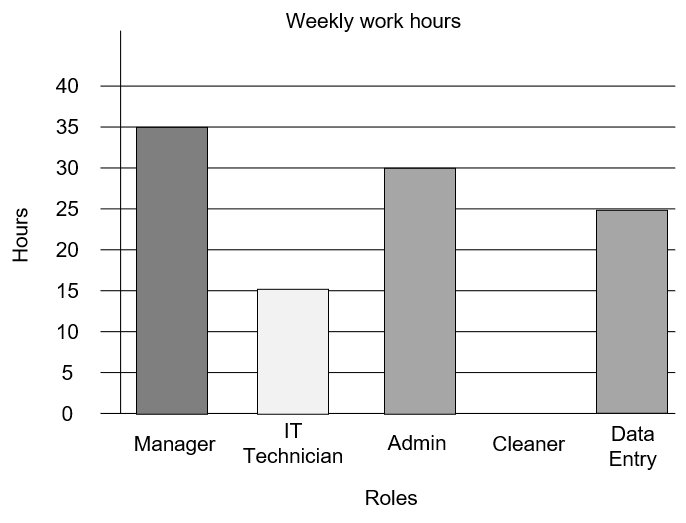
1(a). Calculate the number of hours worked by the cleaner.
[2 marks]
Ans: Simple text
30 hours
Workings:
135 - 35 - 15 - 30 -25 = 30 hours
1(b) Which of the following bar charts correctly represents the number of hours the cleaner works.
Ans: Multiple choice
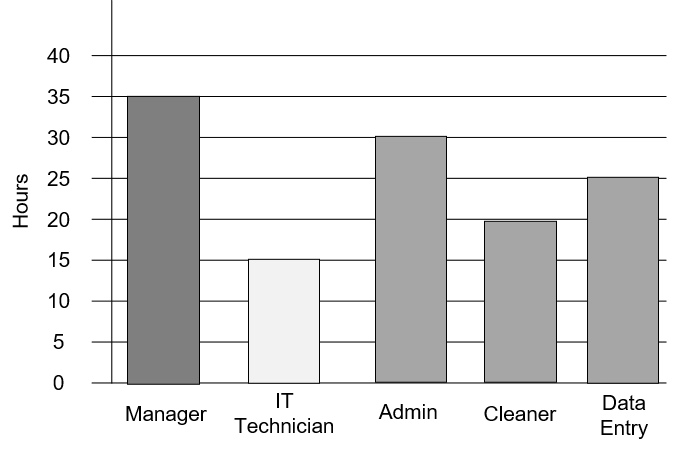
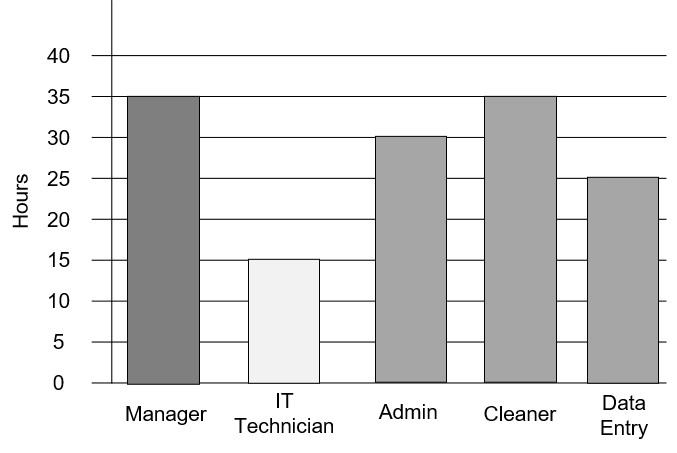
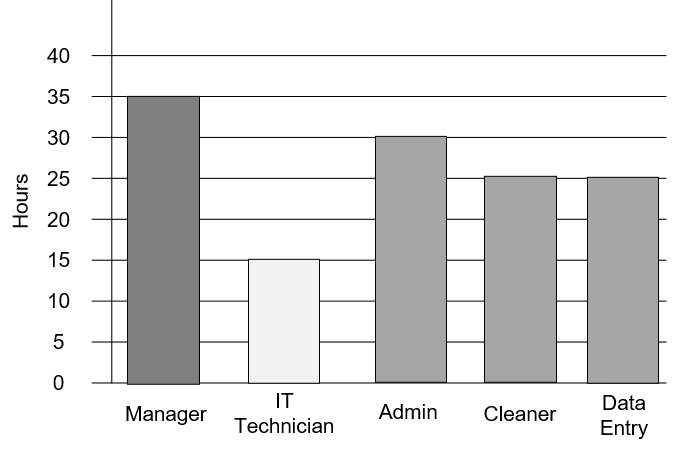
This one is correct
1(c). Find the difference between the role with the most and least hours worked.
[1 mark]
Ans: Simple text
20 hours
Workings:
35 - 15 = 20 hours
2. Consider the following table and graph.
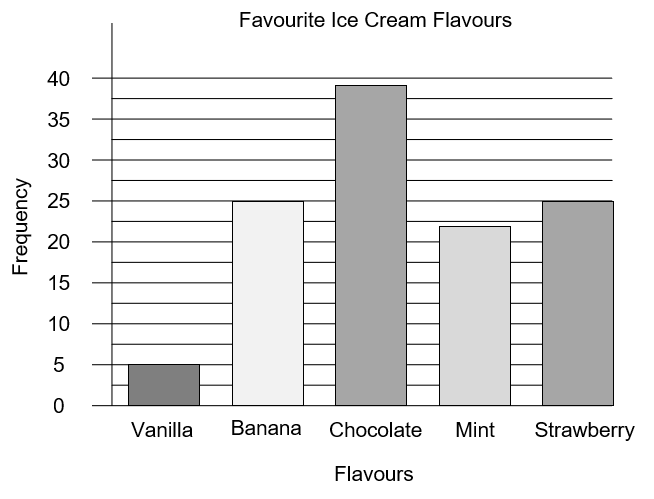

Someone made mistakes copying the information from the graph into the table.
Identify the two flavours for which the data has been copied incorrectly.
[ 2 marks]
Ans: Multiple choice
A: Vanilla and Strawberry
B: Banana and chocolate
C: Mint and Strawberry
D: Chocolate and Strawberry
3.
A maths class took a survey of the other classes in the same year to find out how many children are in each family.
They created the following table.

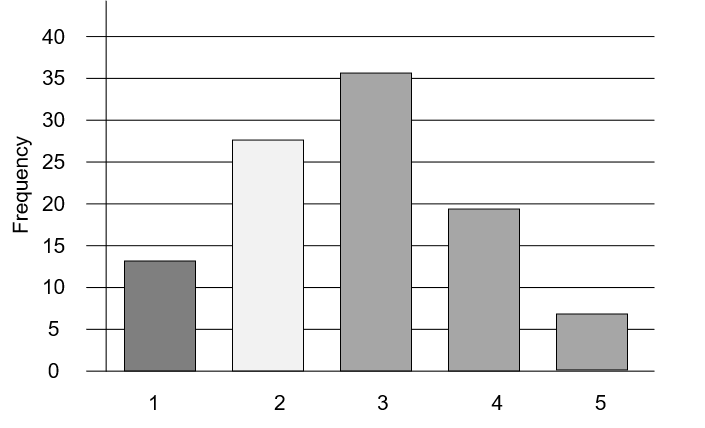
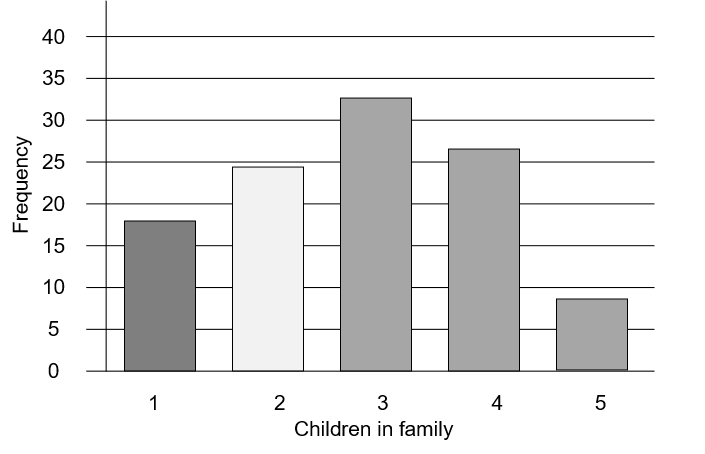
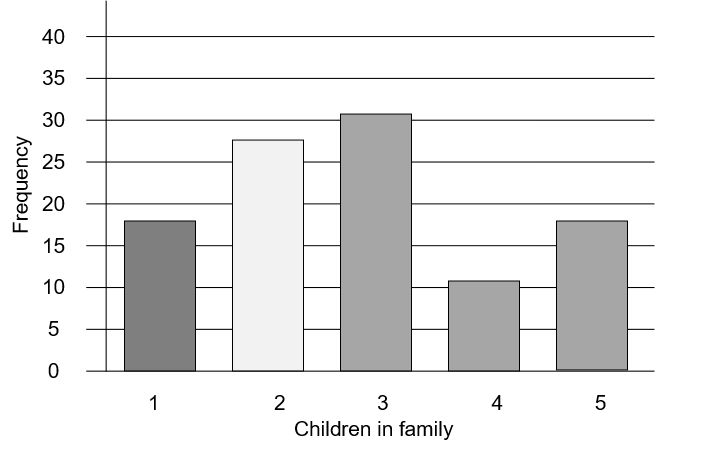
3(a) Which of the following bar charts correctly represents this information.
Ans: Multiple choice
The first one is correct
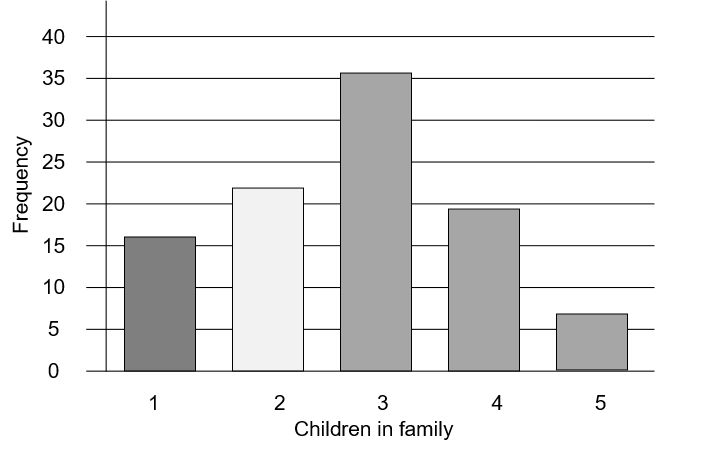
3(b) What percentage of people surveyed had exactly 4 children in their family?
Ans: Simple text
19%
Workings:
The total respondents were 100. 19 people responded with 4 children.
\dfrac{19}{100}=19\%Question 4: [2 marks]
The following graph illustrates the number of hours teachers in a school exercise on a weekly basis.
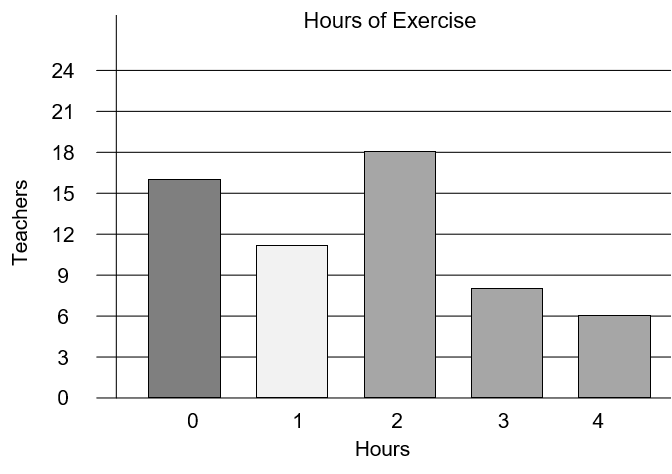
What is the ratio between teachers who do not exercise at all to those who exercise exactly 3 hours a week?
Choose the correct ratio in its simplest form.
Answer type: Multiple choice type 1
A: 2 : 1
B: 1 : 2
C: 1 : 1
D: 3 : 2
ANSWER: A: 2 : 1
WORKING:
16 do not exercise : 8 exercise for three hours
Which simplifies to 2 : 1
Question 5:
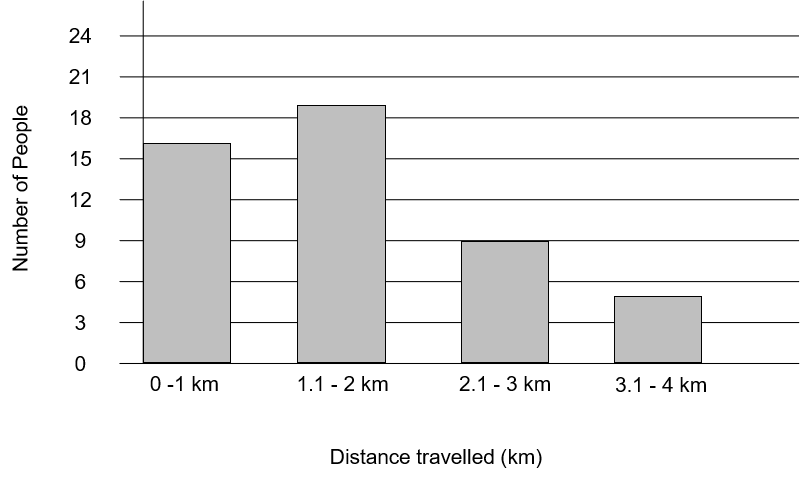
The following graph displays information gathered from a survey in the city centre.
Question 5(a): [1 mark]
Choose the most suitable title for the graph.
Answer type: Multiple choice type 1
A: Distances People Travel to get to the City Centre
B: Distances
C: People travelling to the City Centre
D: Number of people who work in the city centre
ANSWER: A
Question 5(b): [3 marks]
Find the values of a, b and c in the table below which represent the data presented in the graph.

Answer type: Multiple answers type 1
ANSWER:
a = 16
b = 9
c = 5
Question 6:
A survey was taken by 400 students.
Students were asked which industry they hoped to work in. The data is shown below.

Question 6(a): [1 mark]
Find the value of a from the table above.
Answer type: Simple text answer
ANSWER: a = 47
WORKING:
a = 400 - (72 + 49 + 57 + 85 + 90) = 47
Question 6(b): [3 marks]
Choose the correctly plotted bar chart using this information.
Answer type: Multiple choice type 1
A: 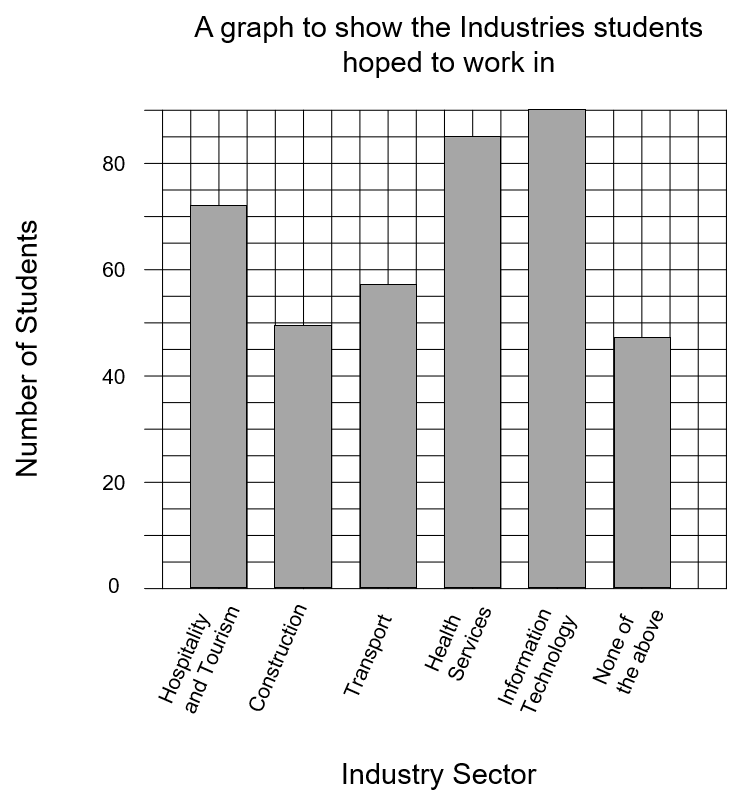
B: 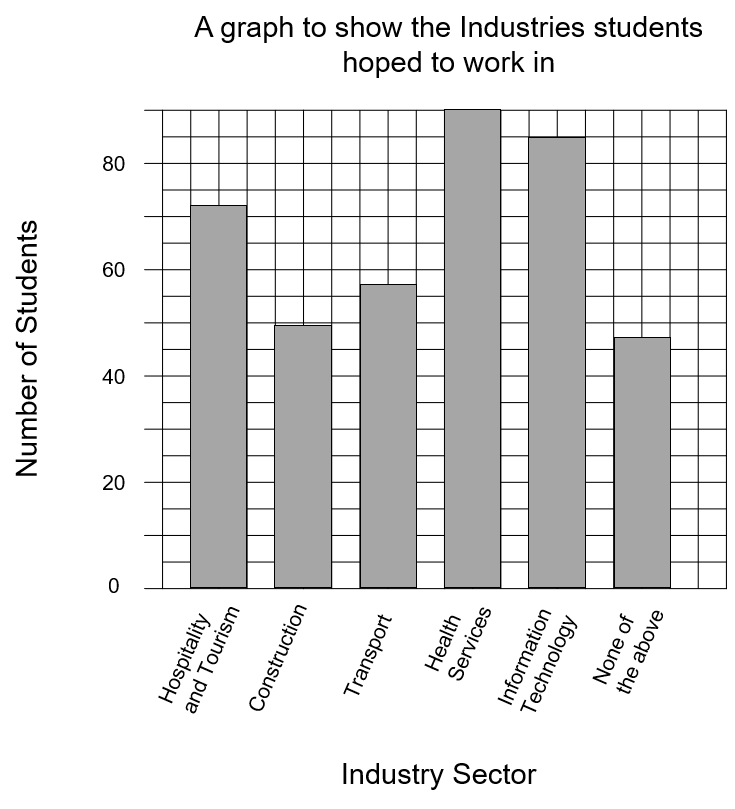
C: 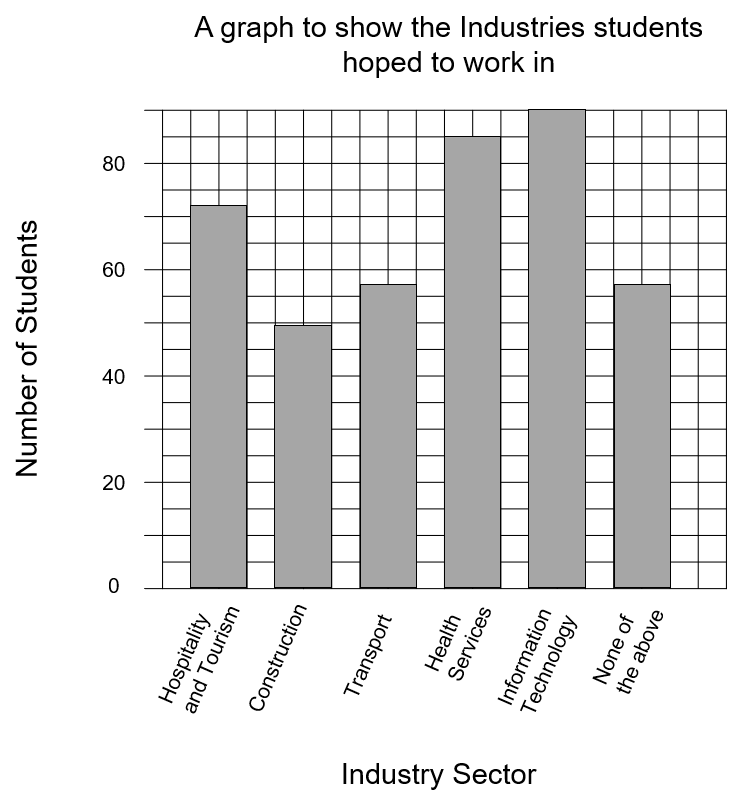
D: 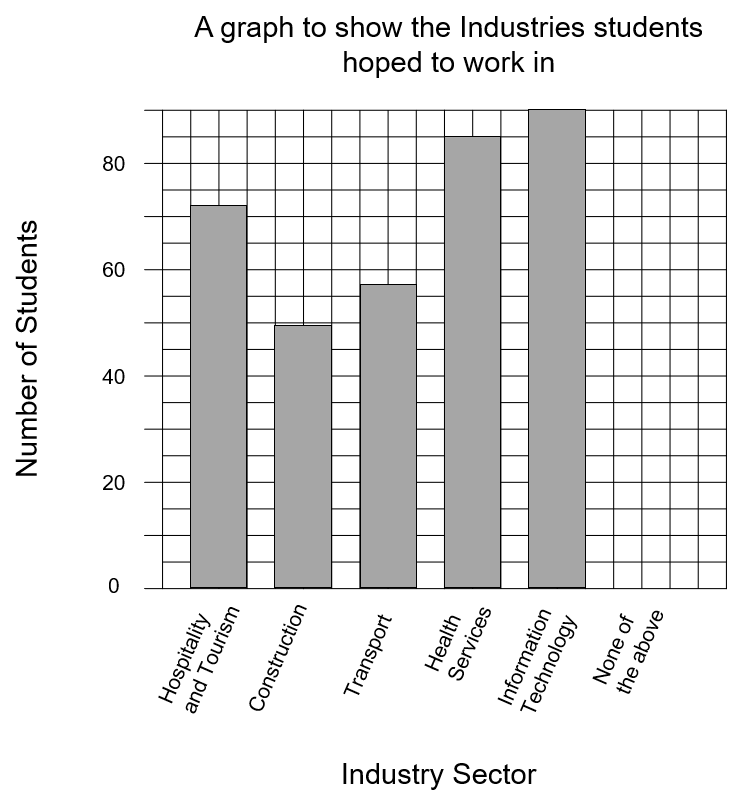
ANSWER: A
Question 6(c): [3 marks]
What percentage of the students wanted to work in either Hospitality and Tourism or Health Services?
Give your answer to 2 decimal places.
Answer type: Simple text answer
ANSWER: 39.25 %
WORKING:
Number of students that wanted to work in either Hospitality and Tourism or Health Services is
72+85 = 157As a percentage of the total number of students, this is
157 \div 400 = 39.25 \%
Question 6(d): [3 marks]
What is the ratio between students who want to work in Transport or Construction and those who do not want to work in Hospitality and Tourism?
Answer type: Multiple choice type 1
A: 53:164
B: 53:36
C: 35:164
D: 49:328
ANSWER: A
WORKING:
Number of students that wanted to work in Transport or Construction is
49+57=106Number of students that did not want to work in Hospitality and Tourism is
400-72=328As a ratio this is 106 : 328
which can be simplified to 53:164