Question 1: [1 mark]
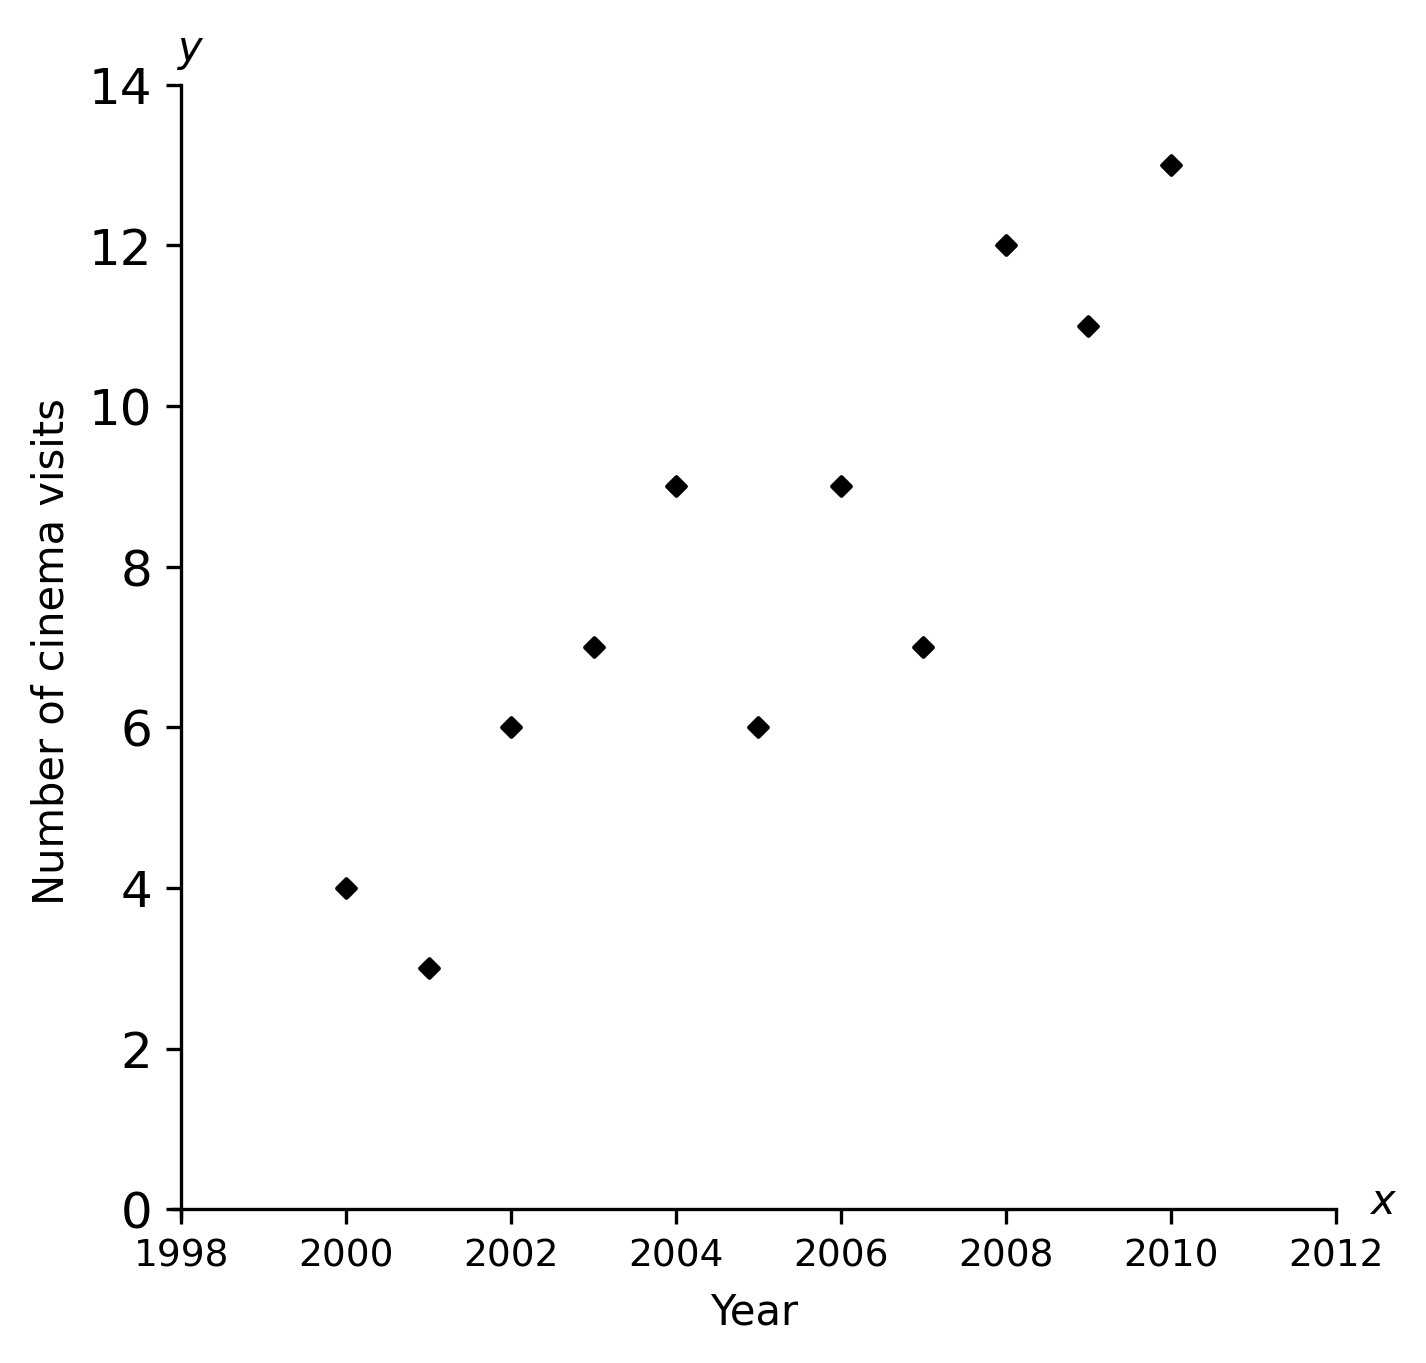
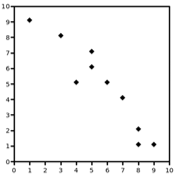
Choose the best line of best fit for the scatter graph below.
Answer type: Multiple choice type 1
A: 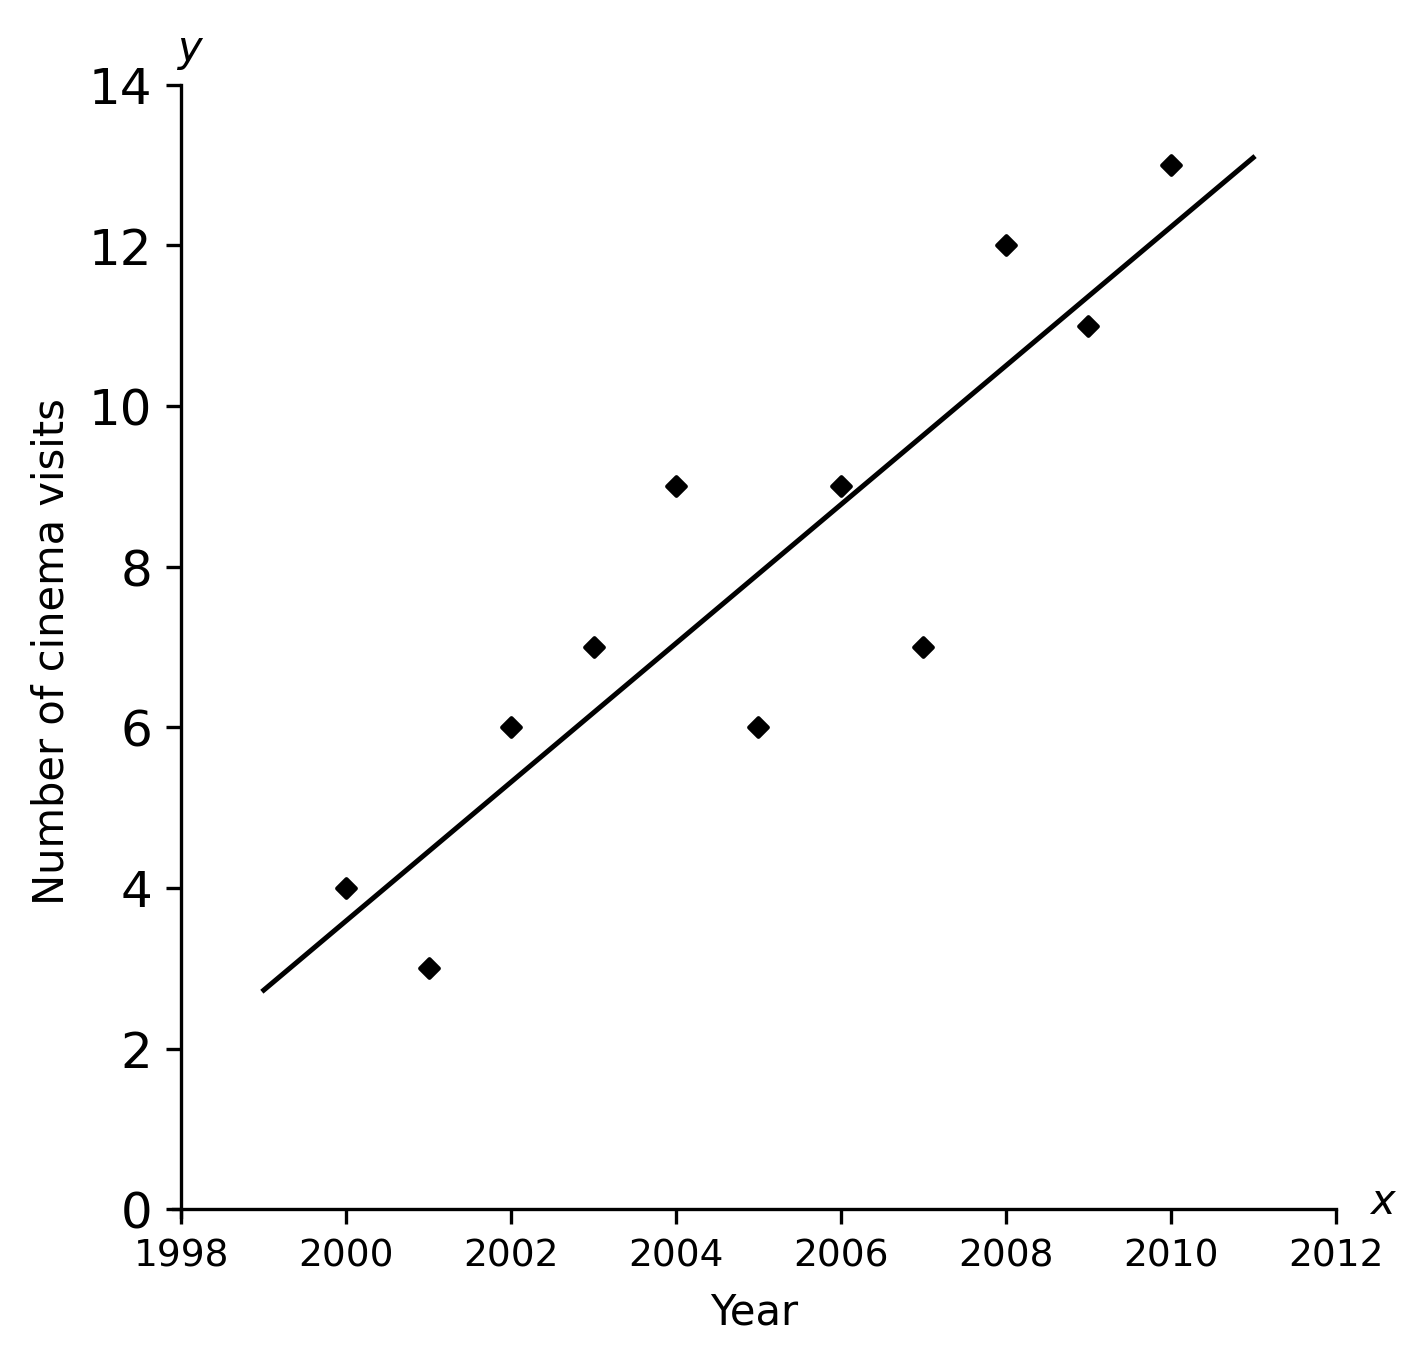
B: 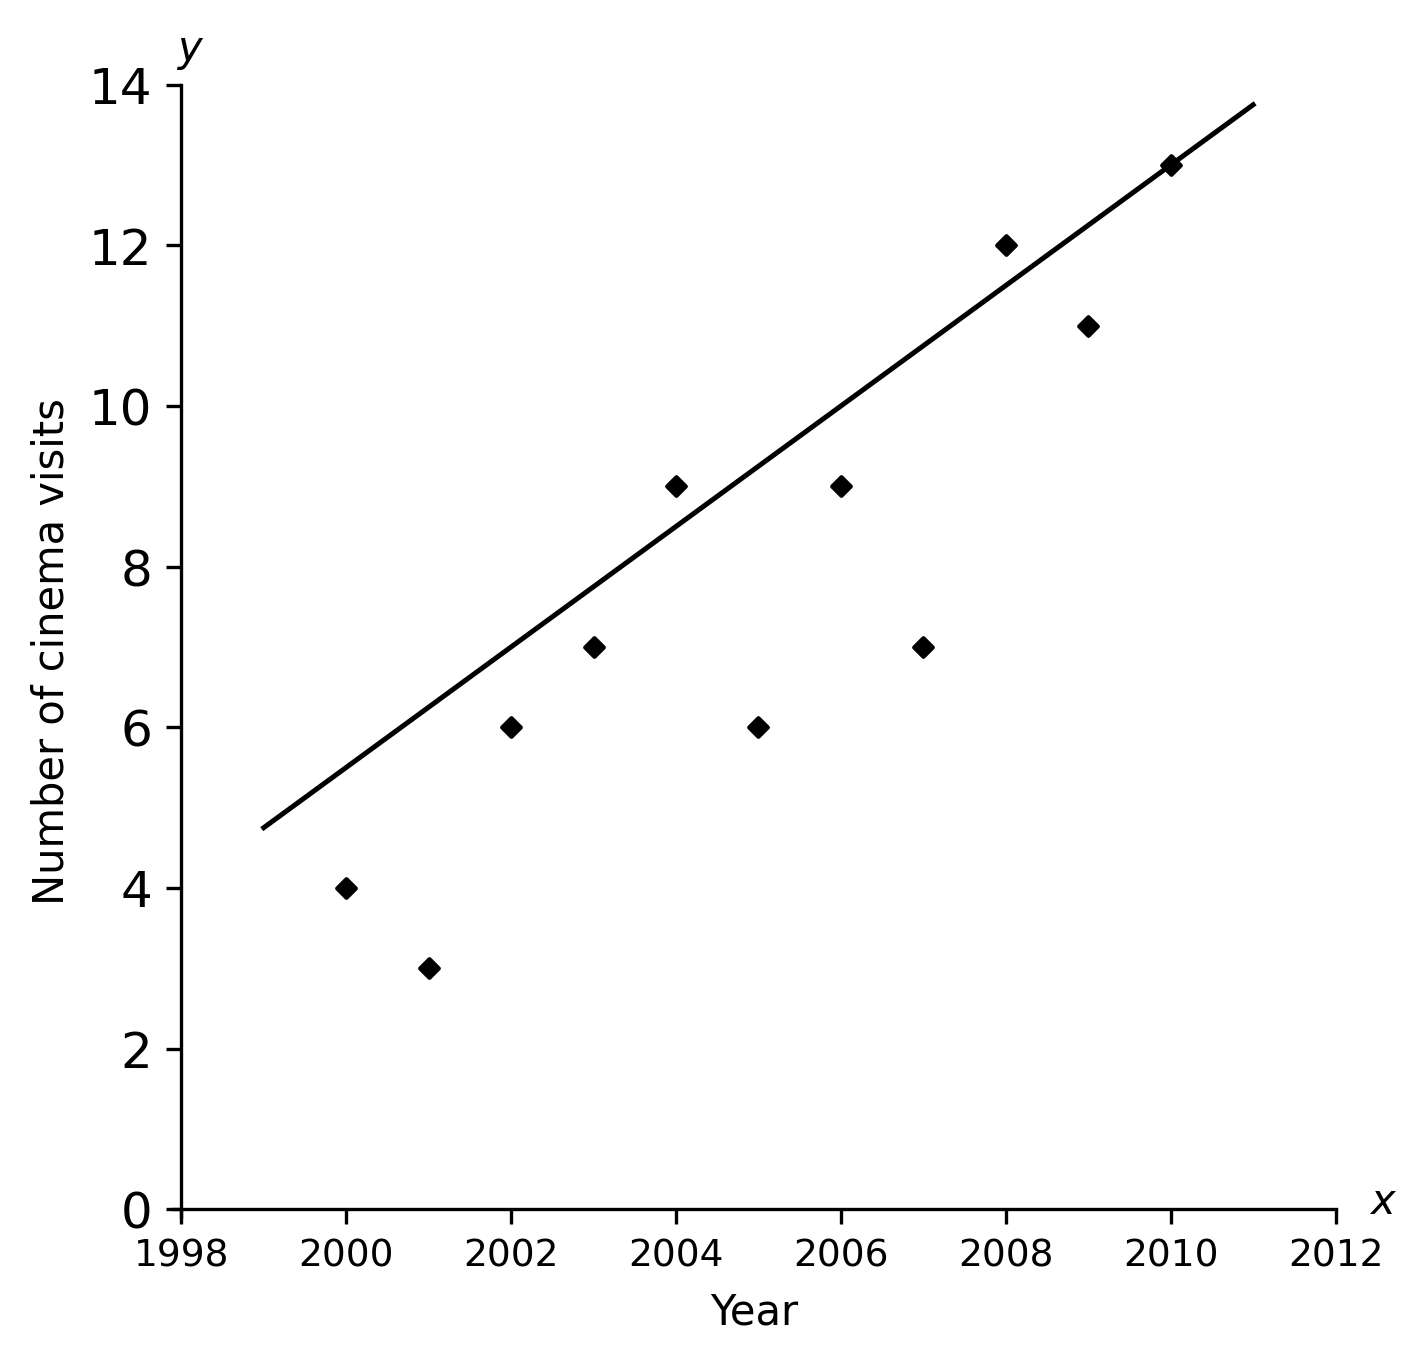
C: 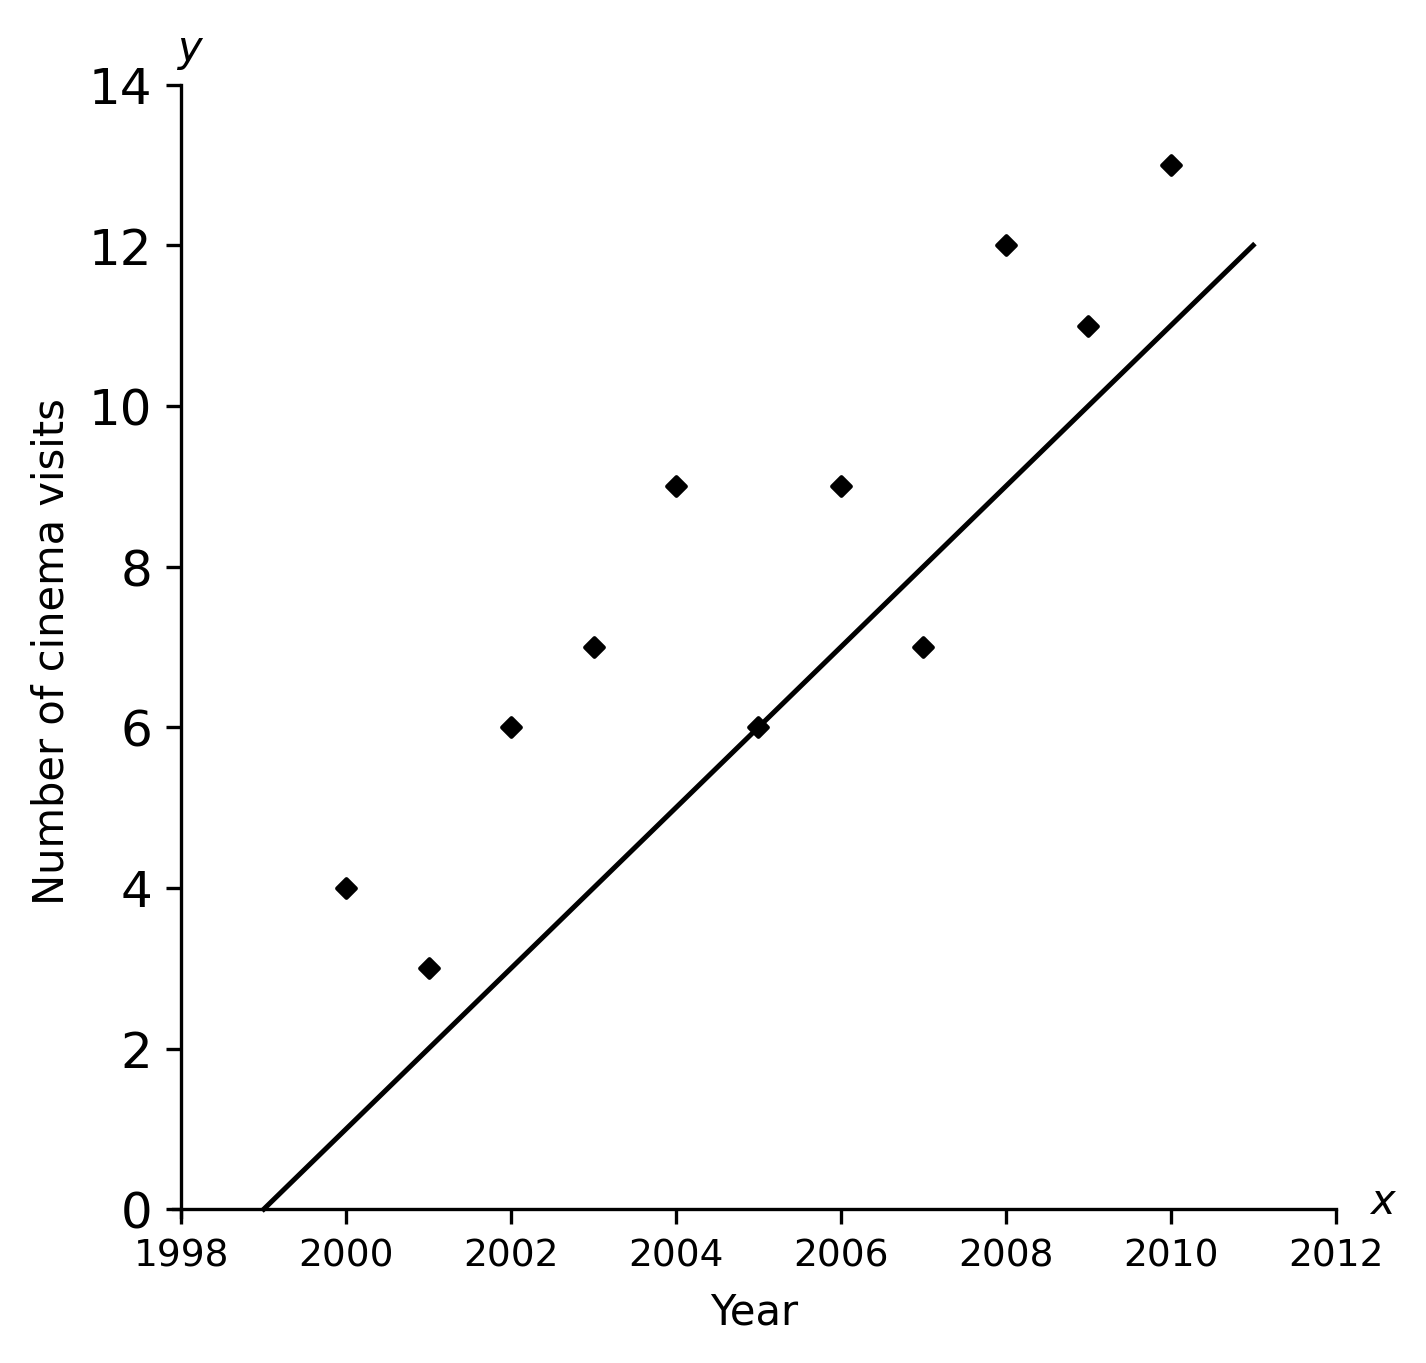
D: 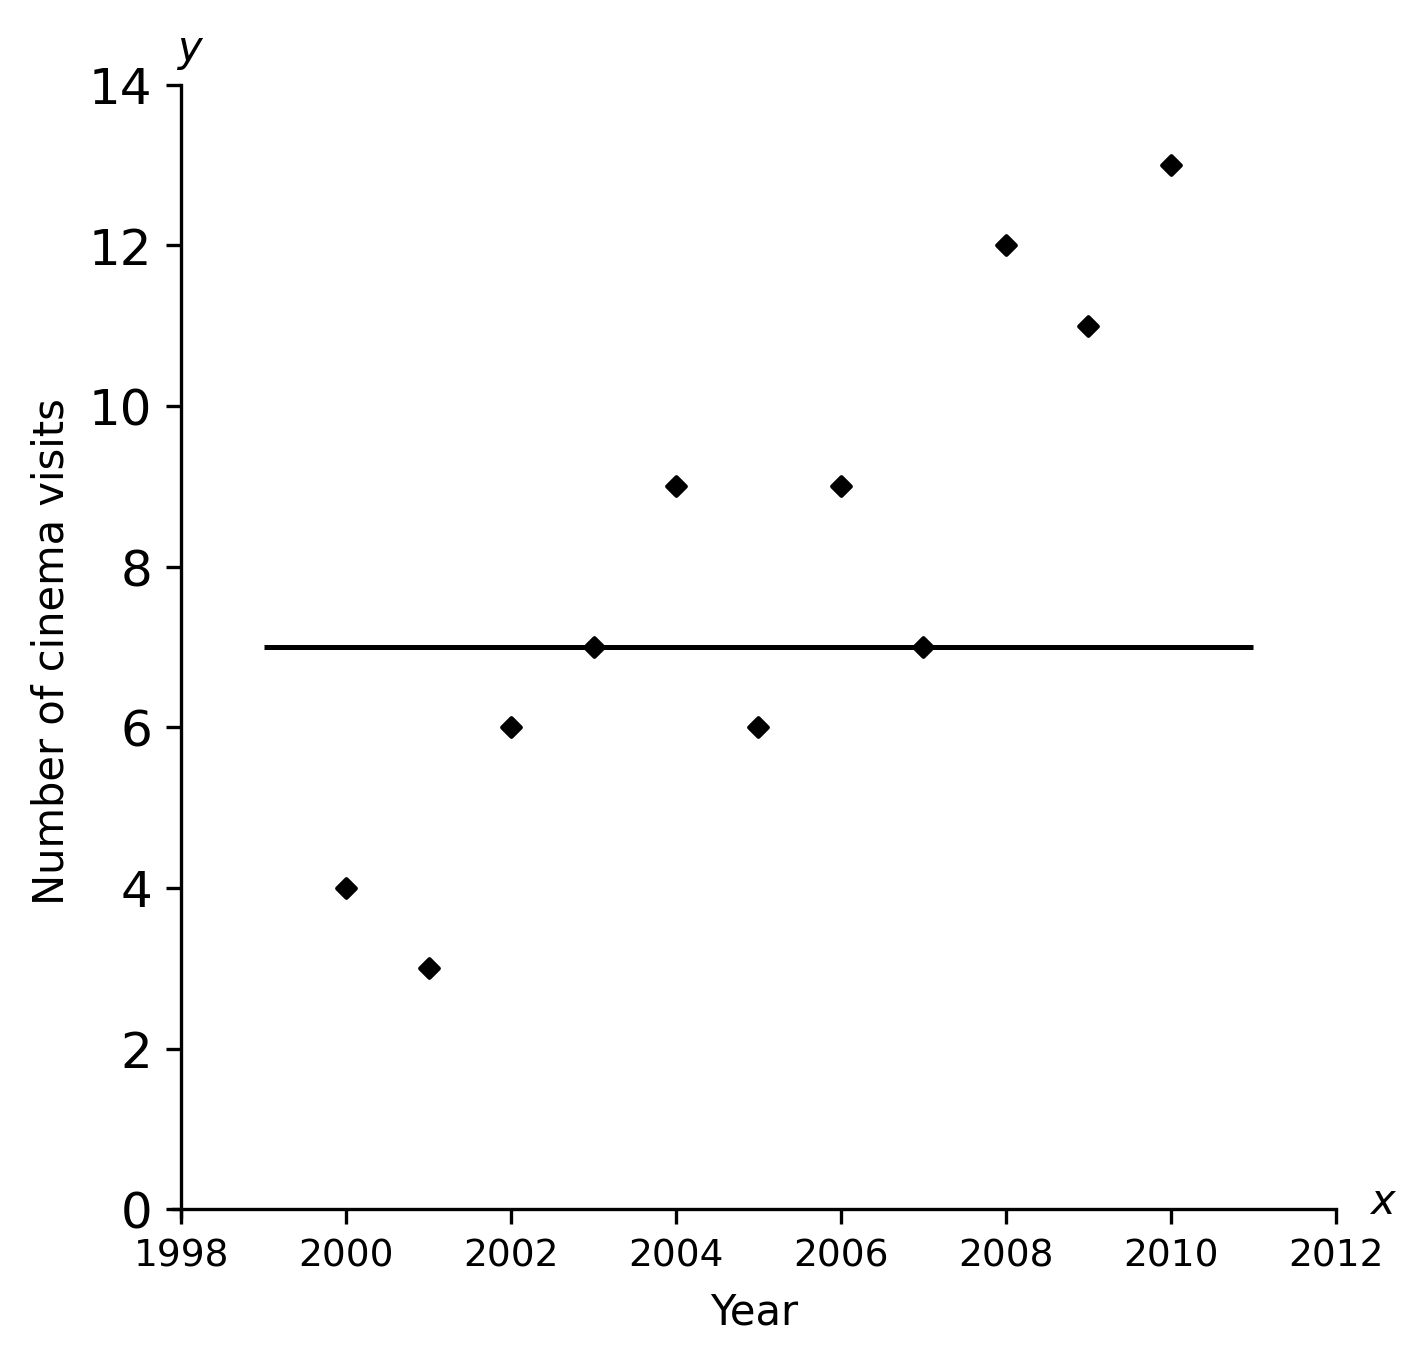
ANSWER: A: A
Question 2:
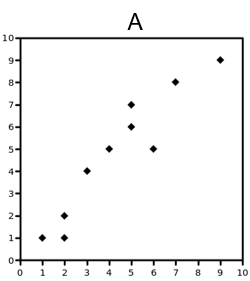
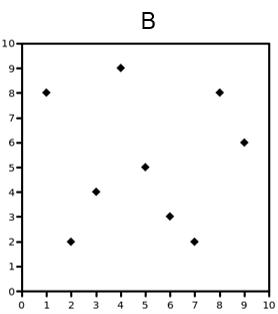
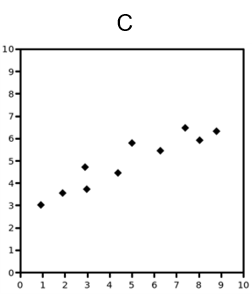
Choose the answer that best describes the correlation of the following scatter graphs.
Question 2(a): [1 mark]
Answer type: Multiple choice type 2
A: Weak positive
B: Strong positive
C: Weak negative
D: Strong negative
E: No correlation
ANSWER: B: Strong positive
Question 2(b): [1 mark]
Answer type: Multiple choice type 2
A: Weak positive
B: Strong positive
C: Weak negative
D: Strong negative
E: No correlation
ANSWER: E: No correlation
Question 2(c): [1 mark]
Answer type: Multiple choice type 2
A: Weak positive
B: Strong positive
C: Weak negative
D: Strong negative
E: No correlation
ANSWER: B: Strong positive
Question 2(d): [1 mark]
Answer type: Multiple choice type 2
A: Weak positive
B: Strong positive
C: Weak negative
D: Strong negative
E: No correlation
ANSWER: D: Strong negative
Question 3: [2 marks]
The table below shows the number of rainy days in a month and the number of umbrellas sold for that month.
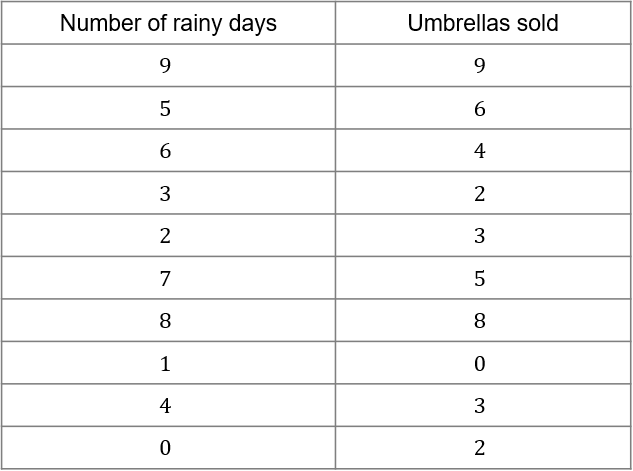
Choose the correct scatter plot using the table above.
Answer type: Multiple choice type 1
A:
B: 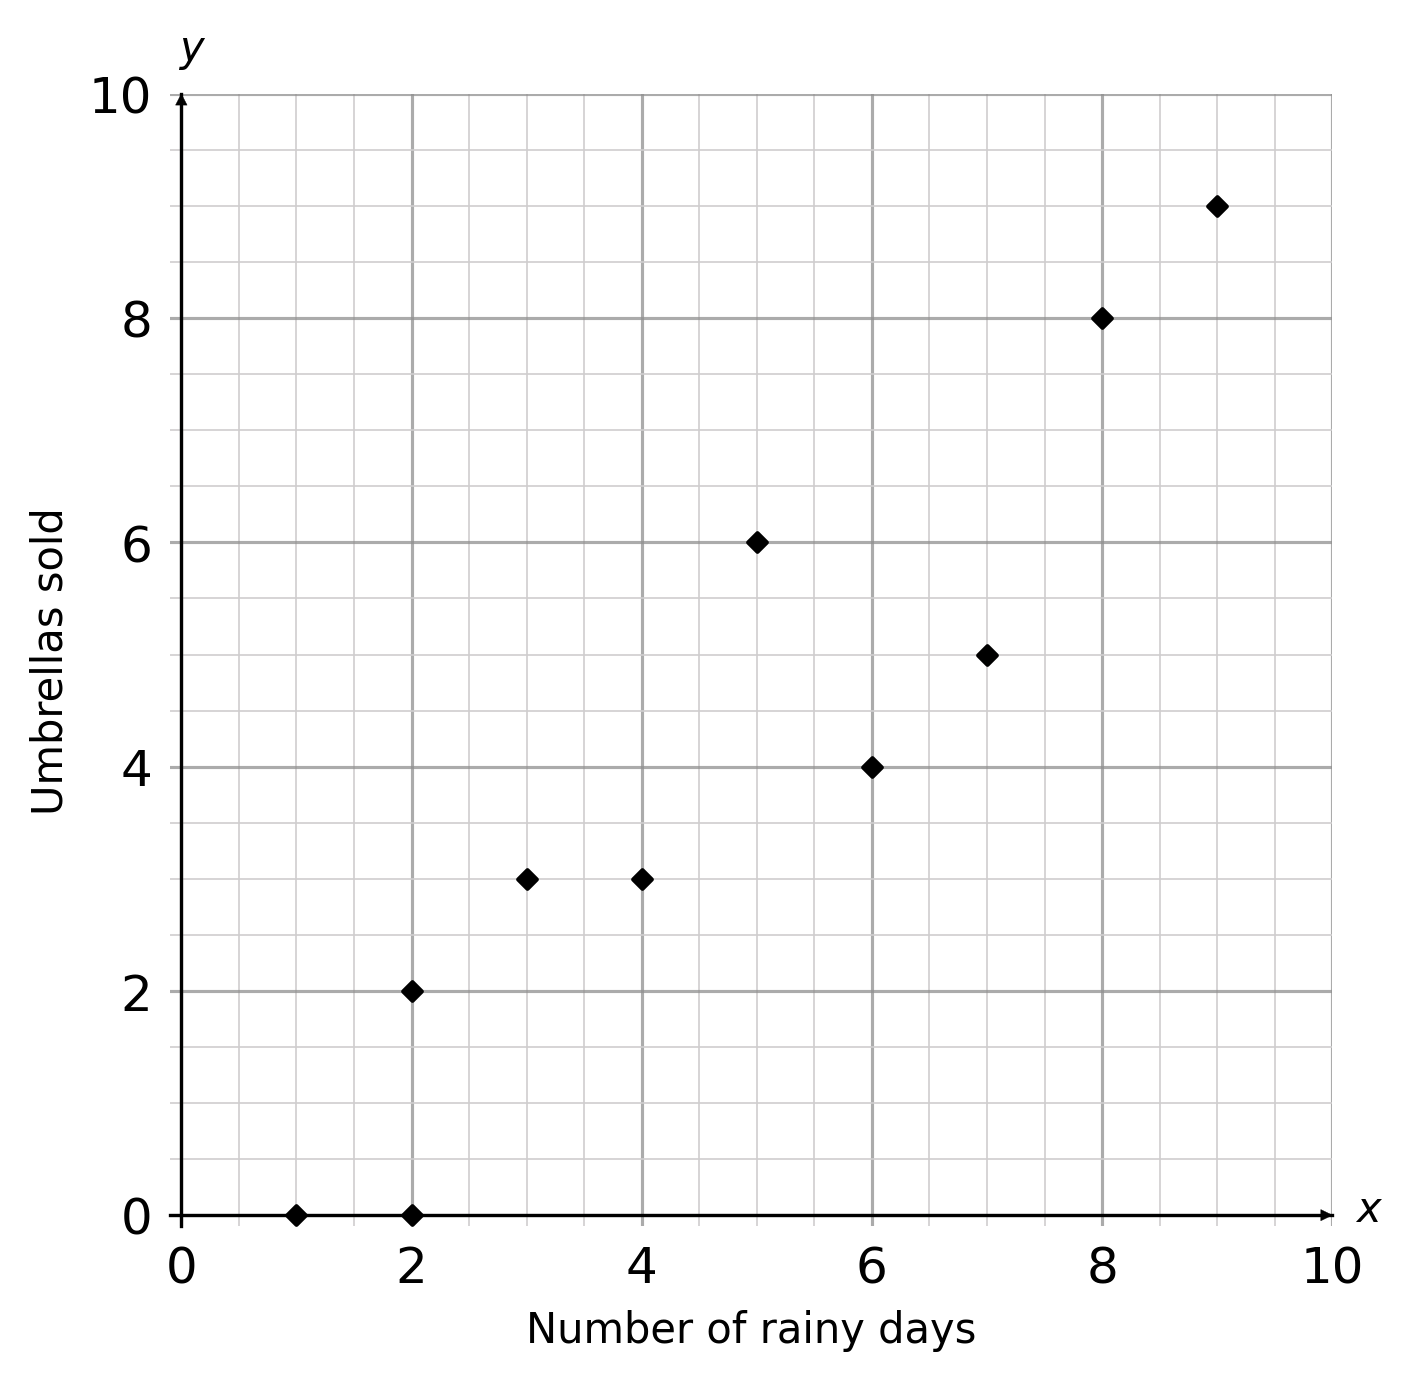
C: 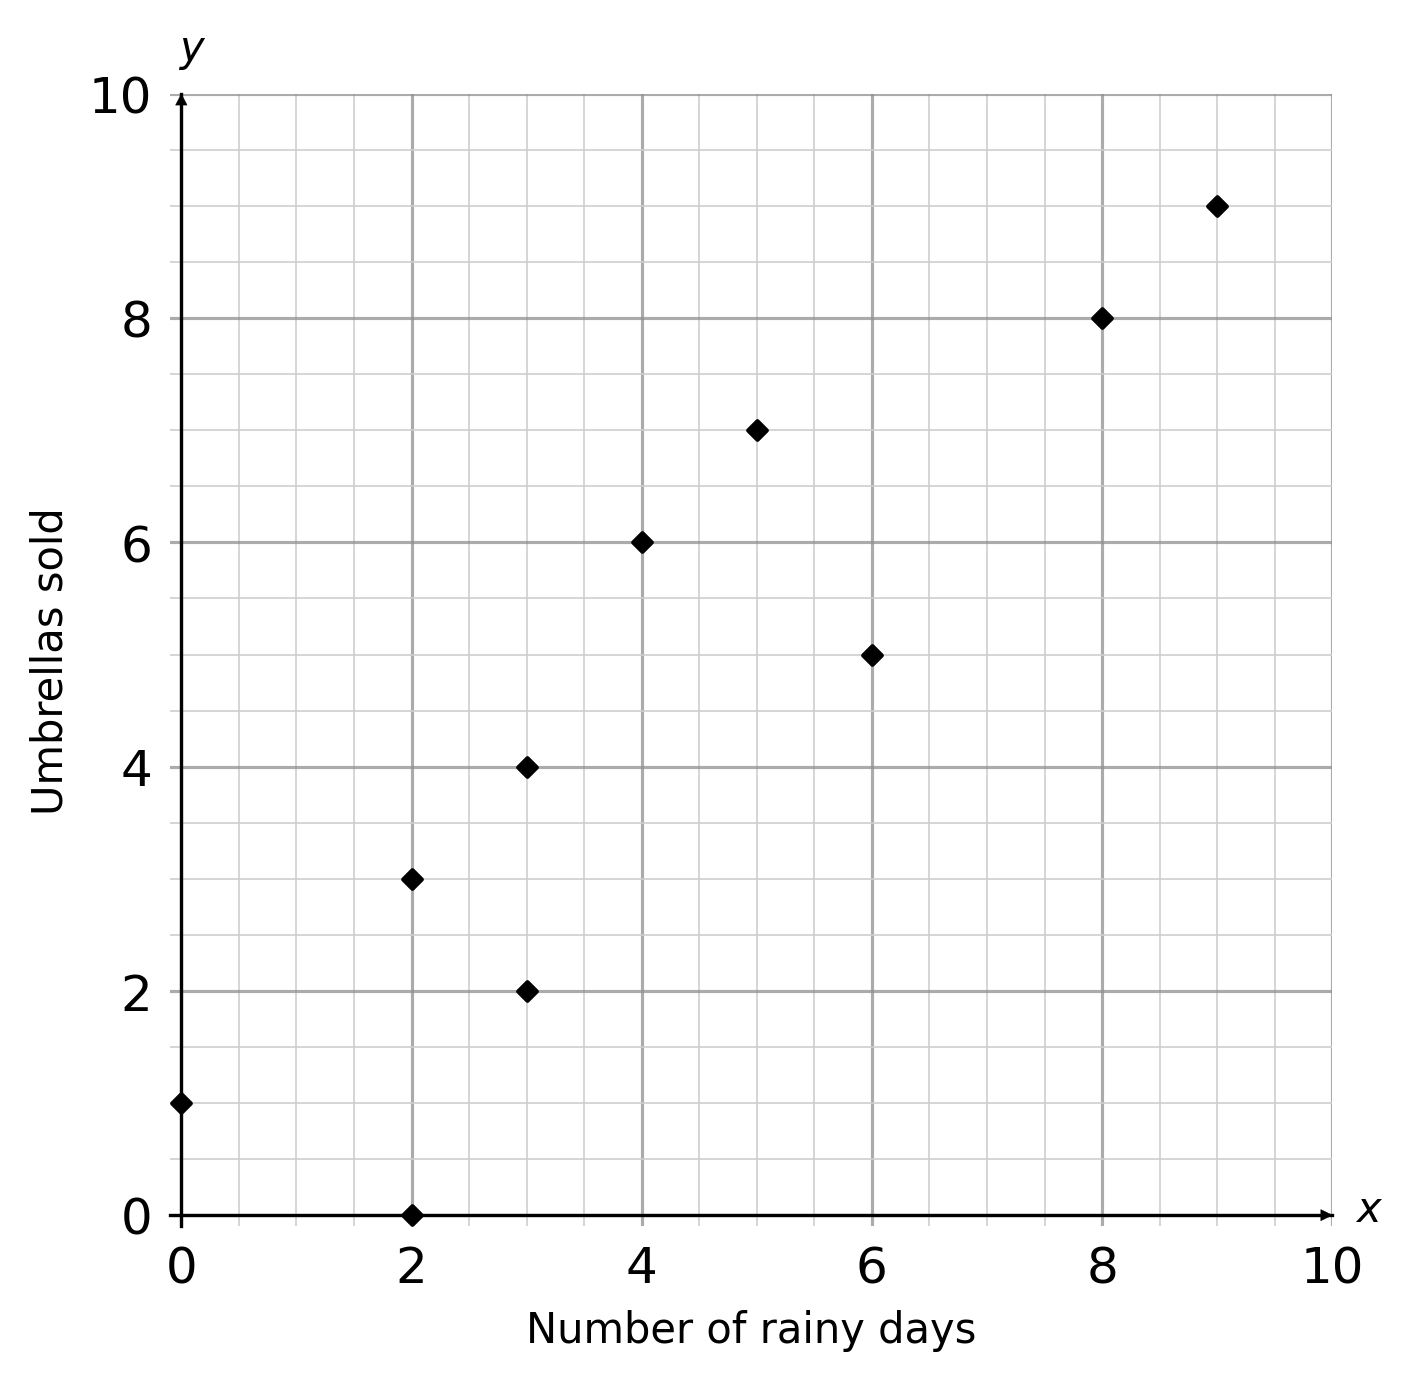
D: 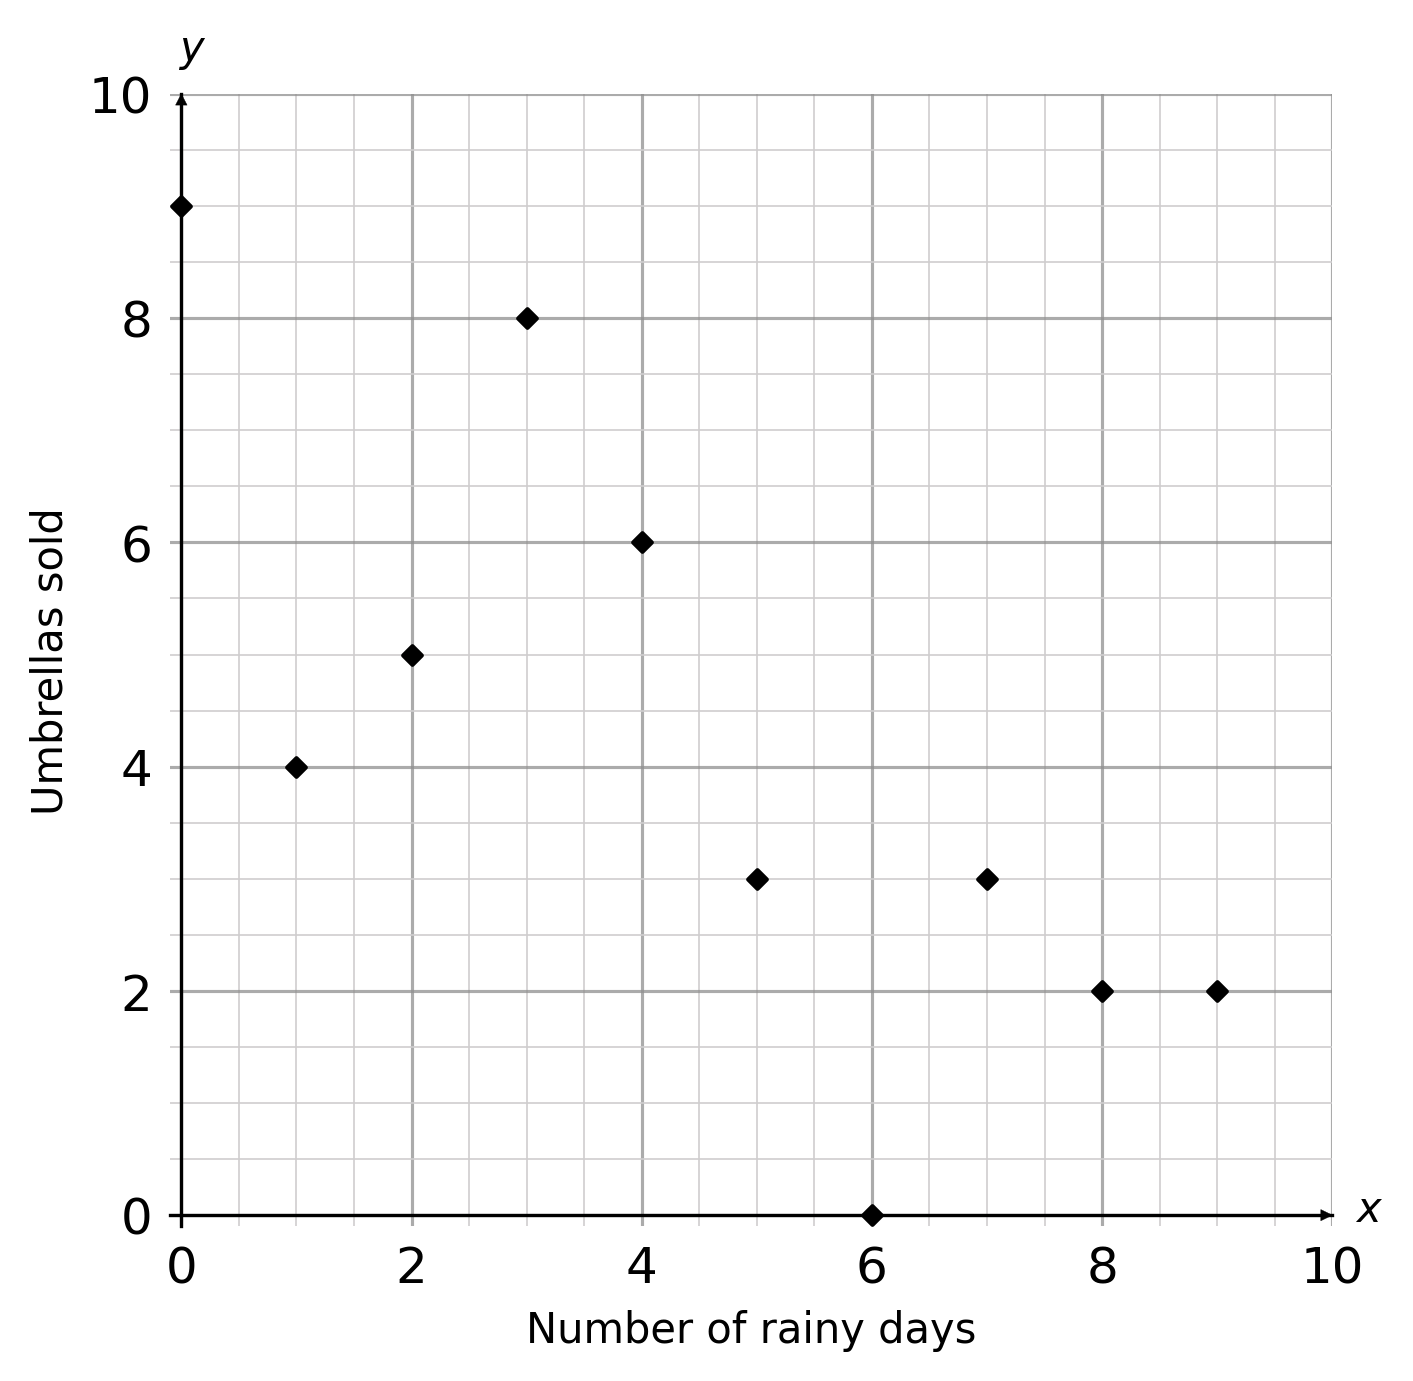
ANSWER: A
Question 4:
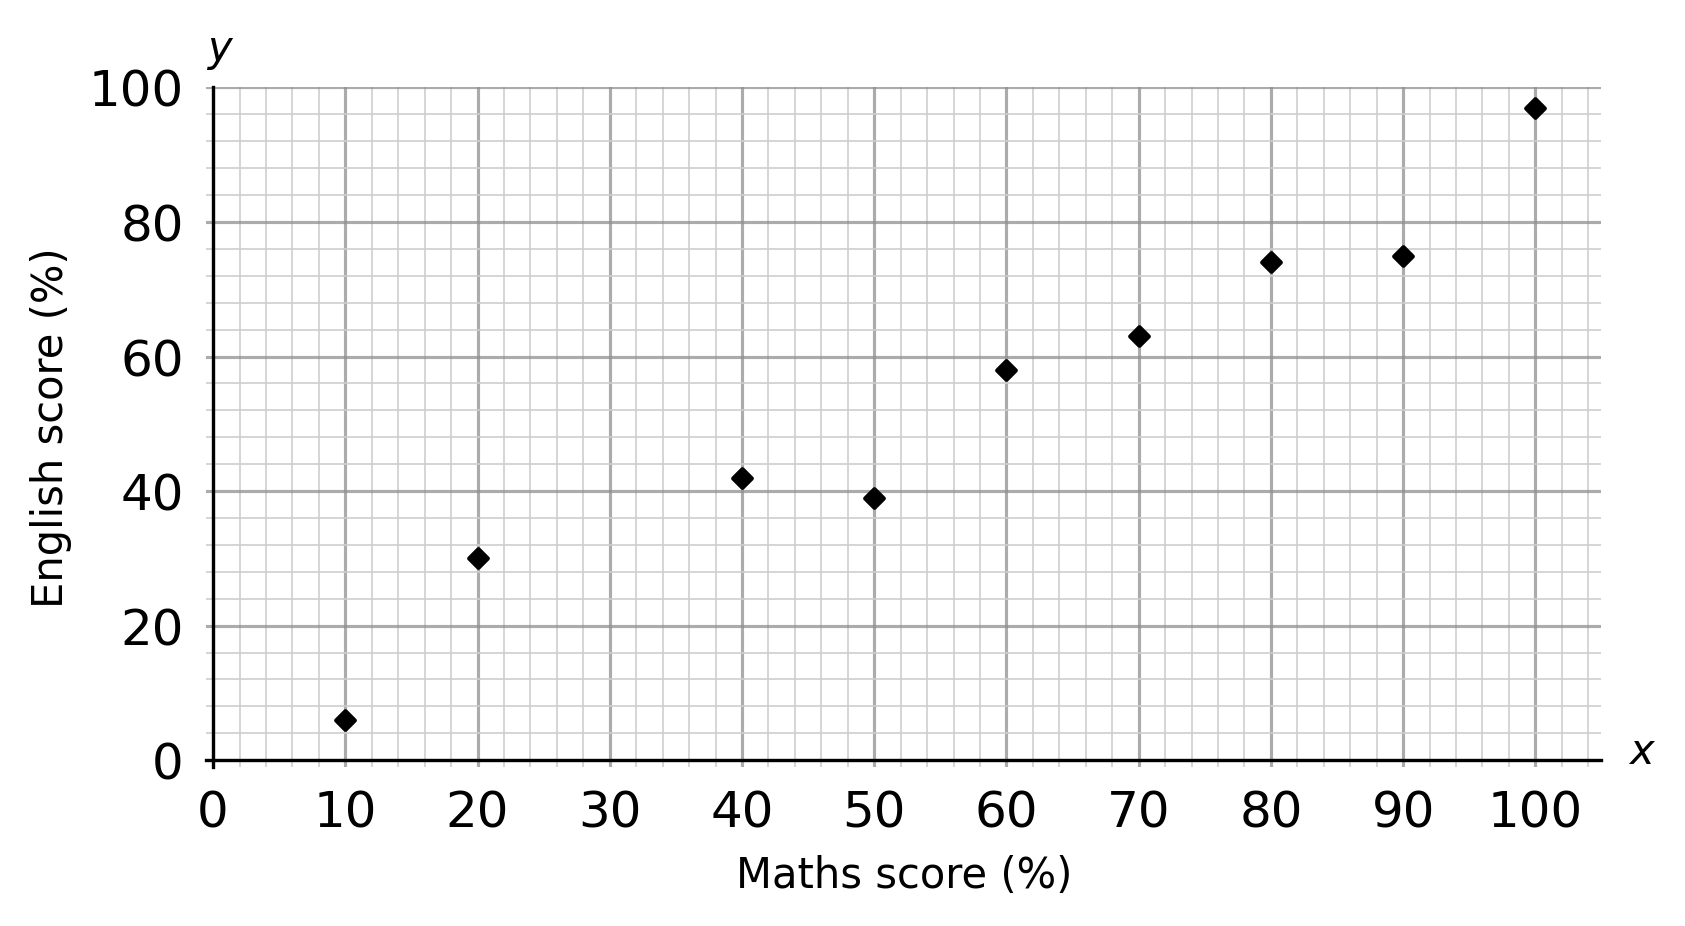
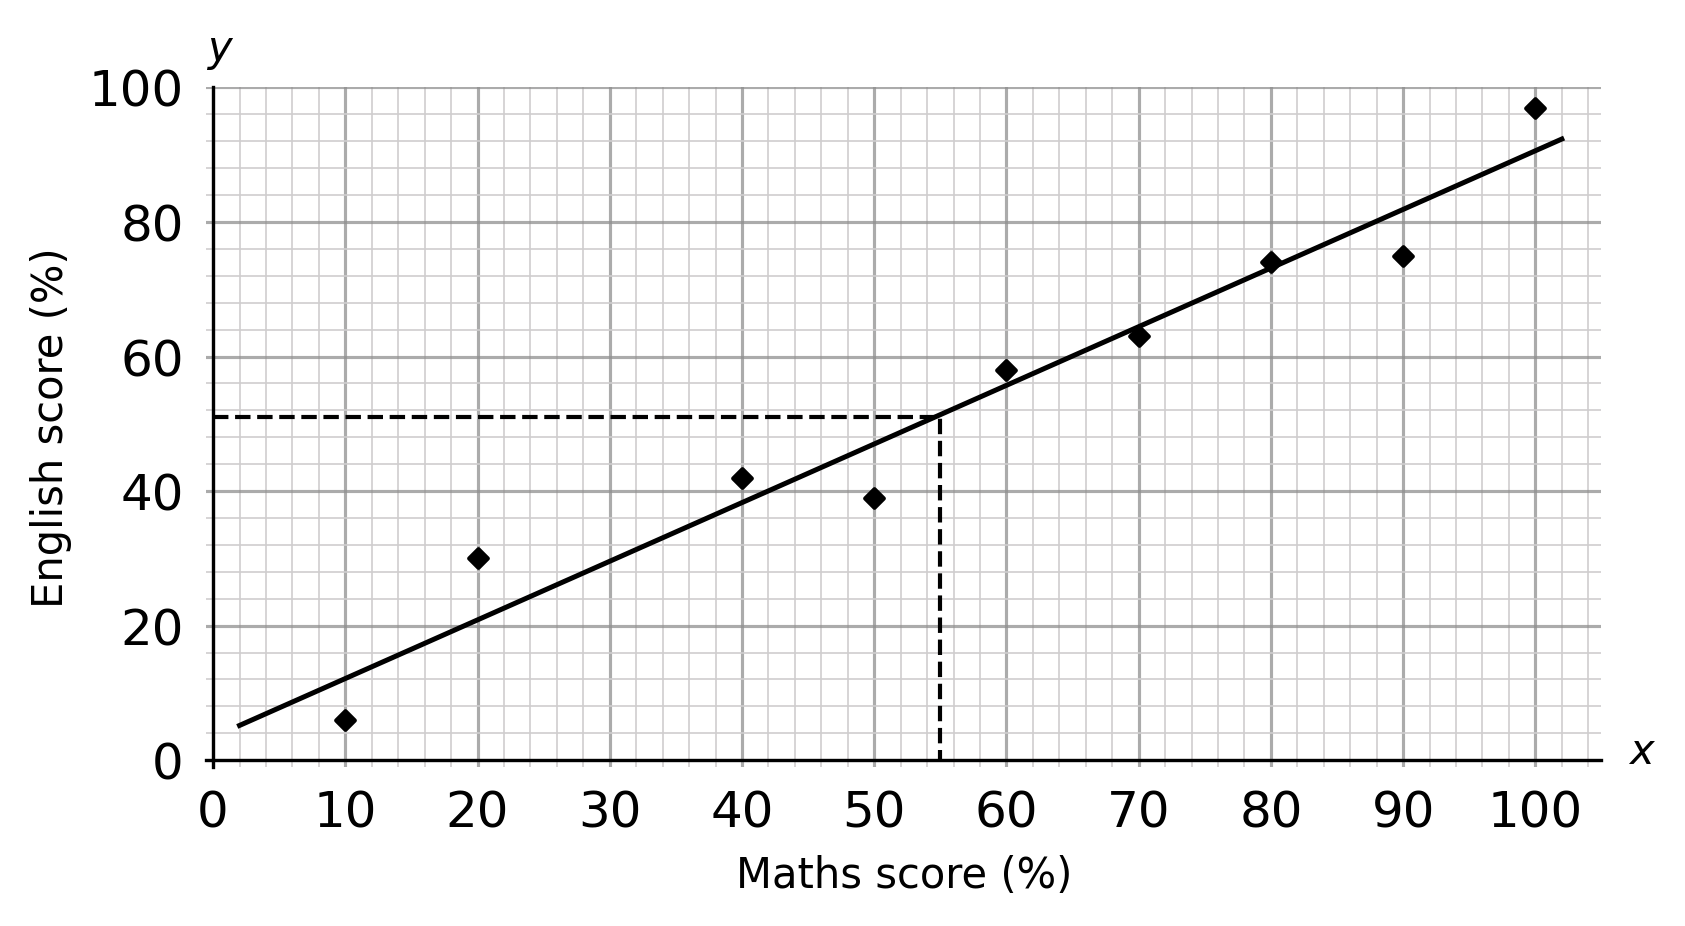
Maths and English test scores for 10 students in a class are plotted in a scatter graph.
Question 4(a): [1 mark]
Choose the best line of best fit for the scatter graph below.
Answer type: Multiple choice type 1
A: 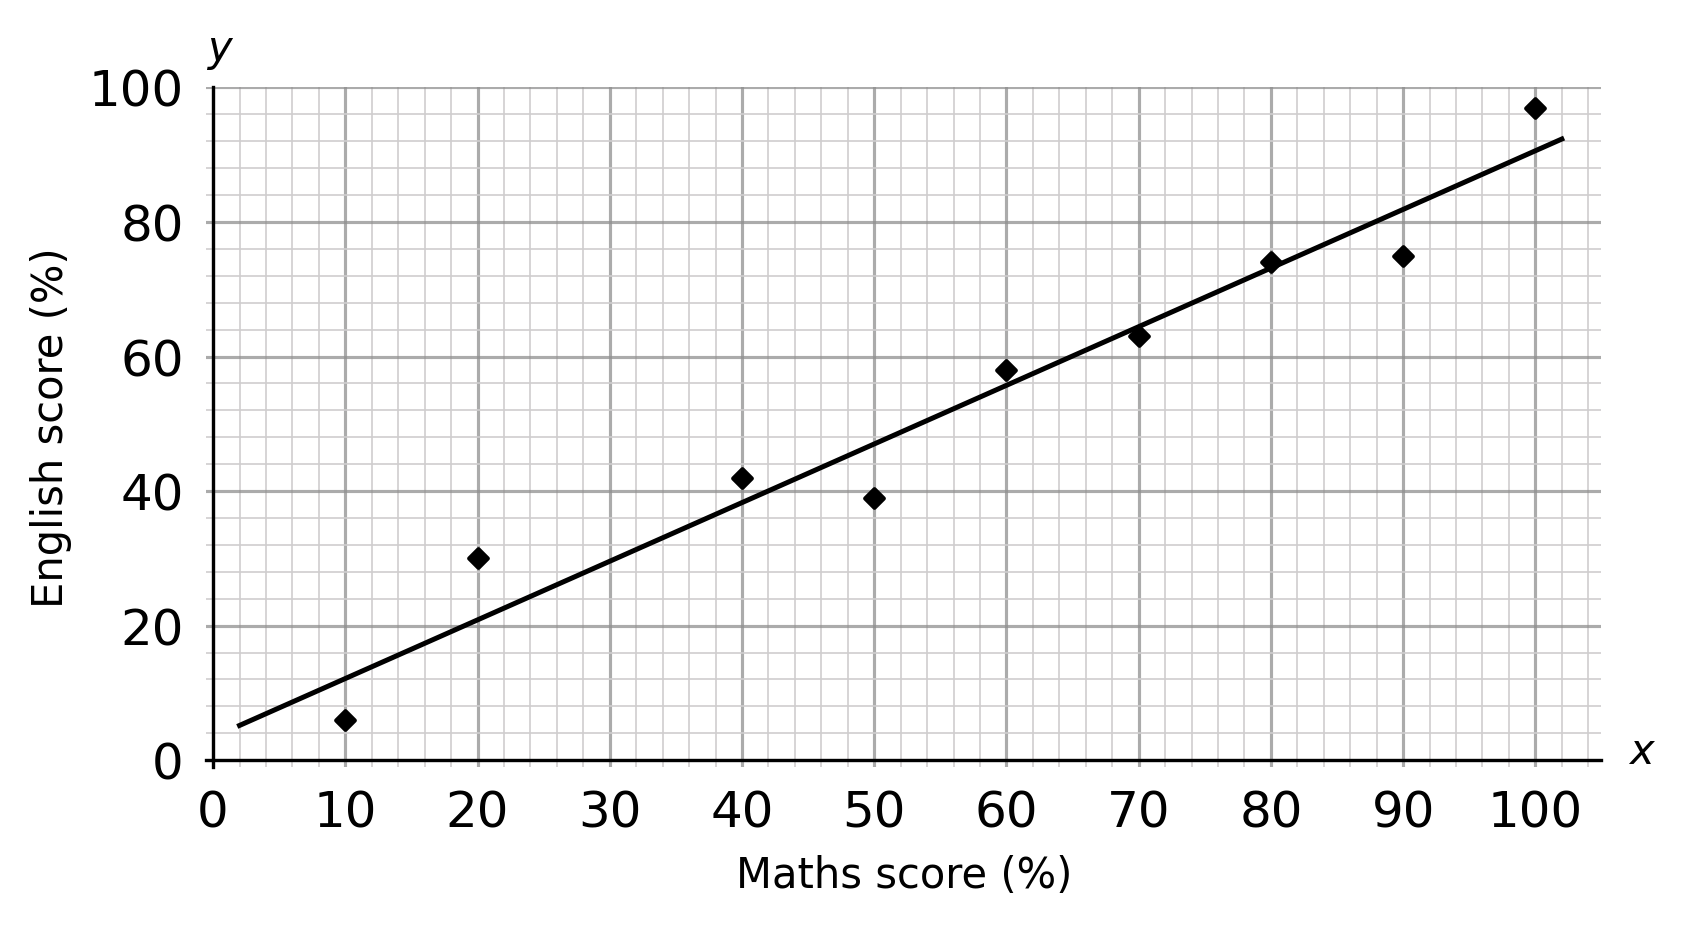
B: 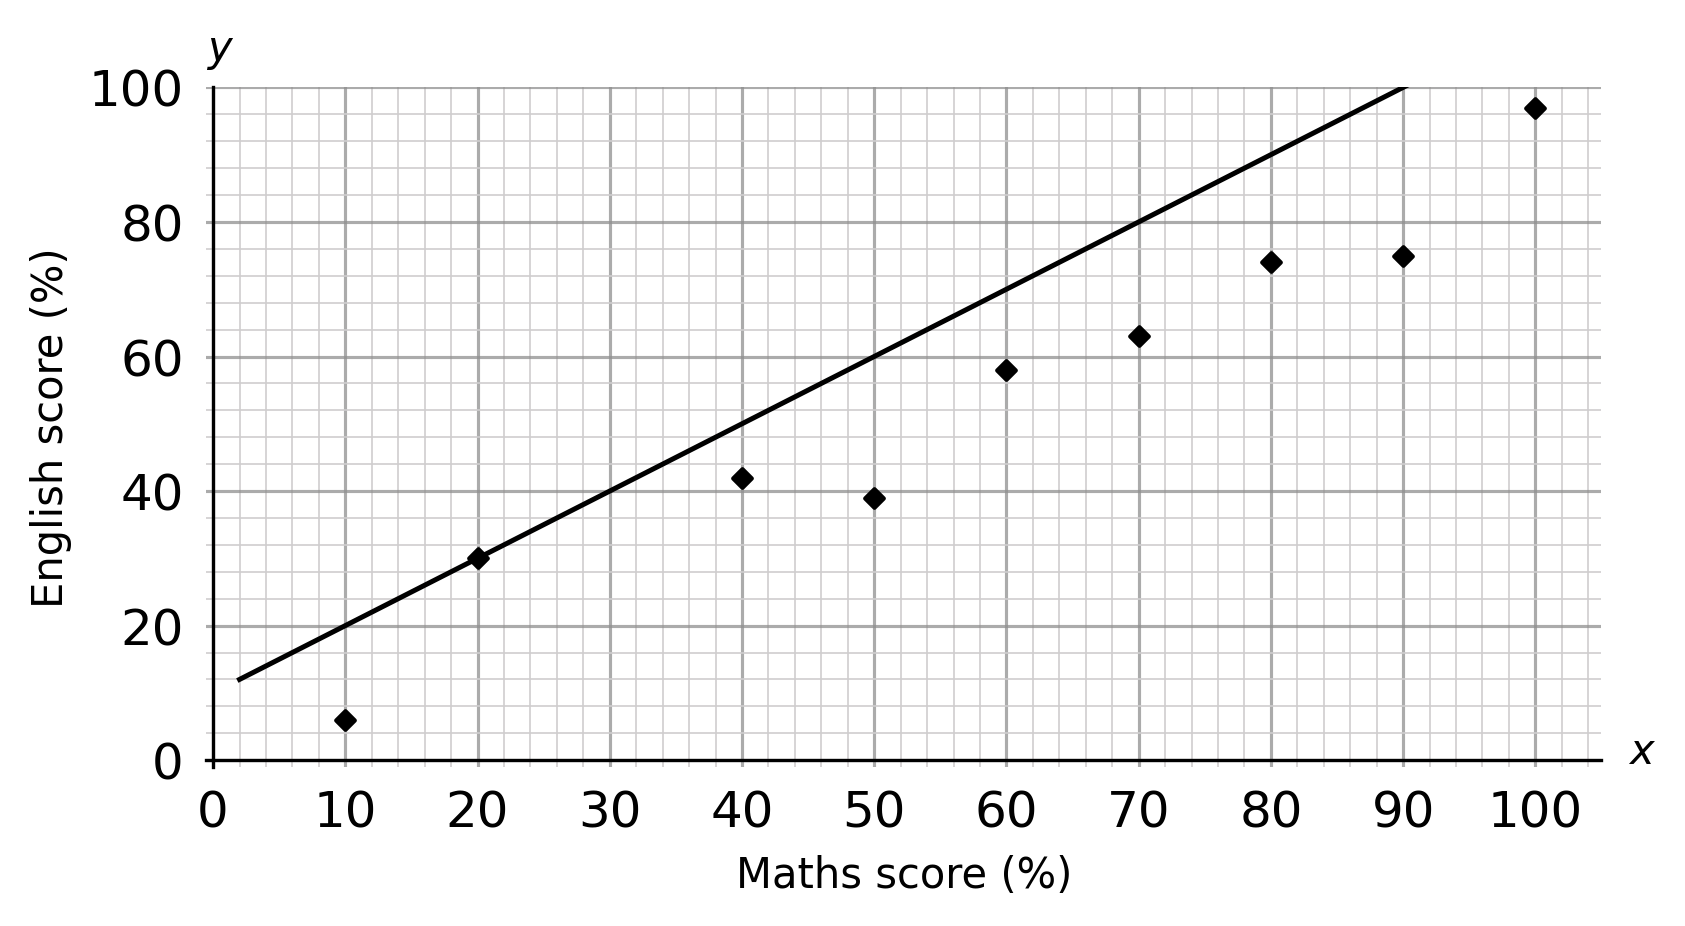
C: 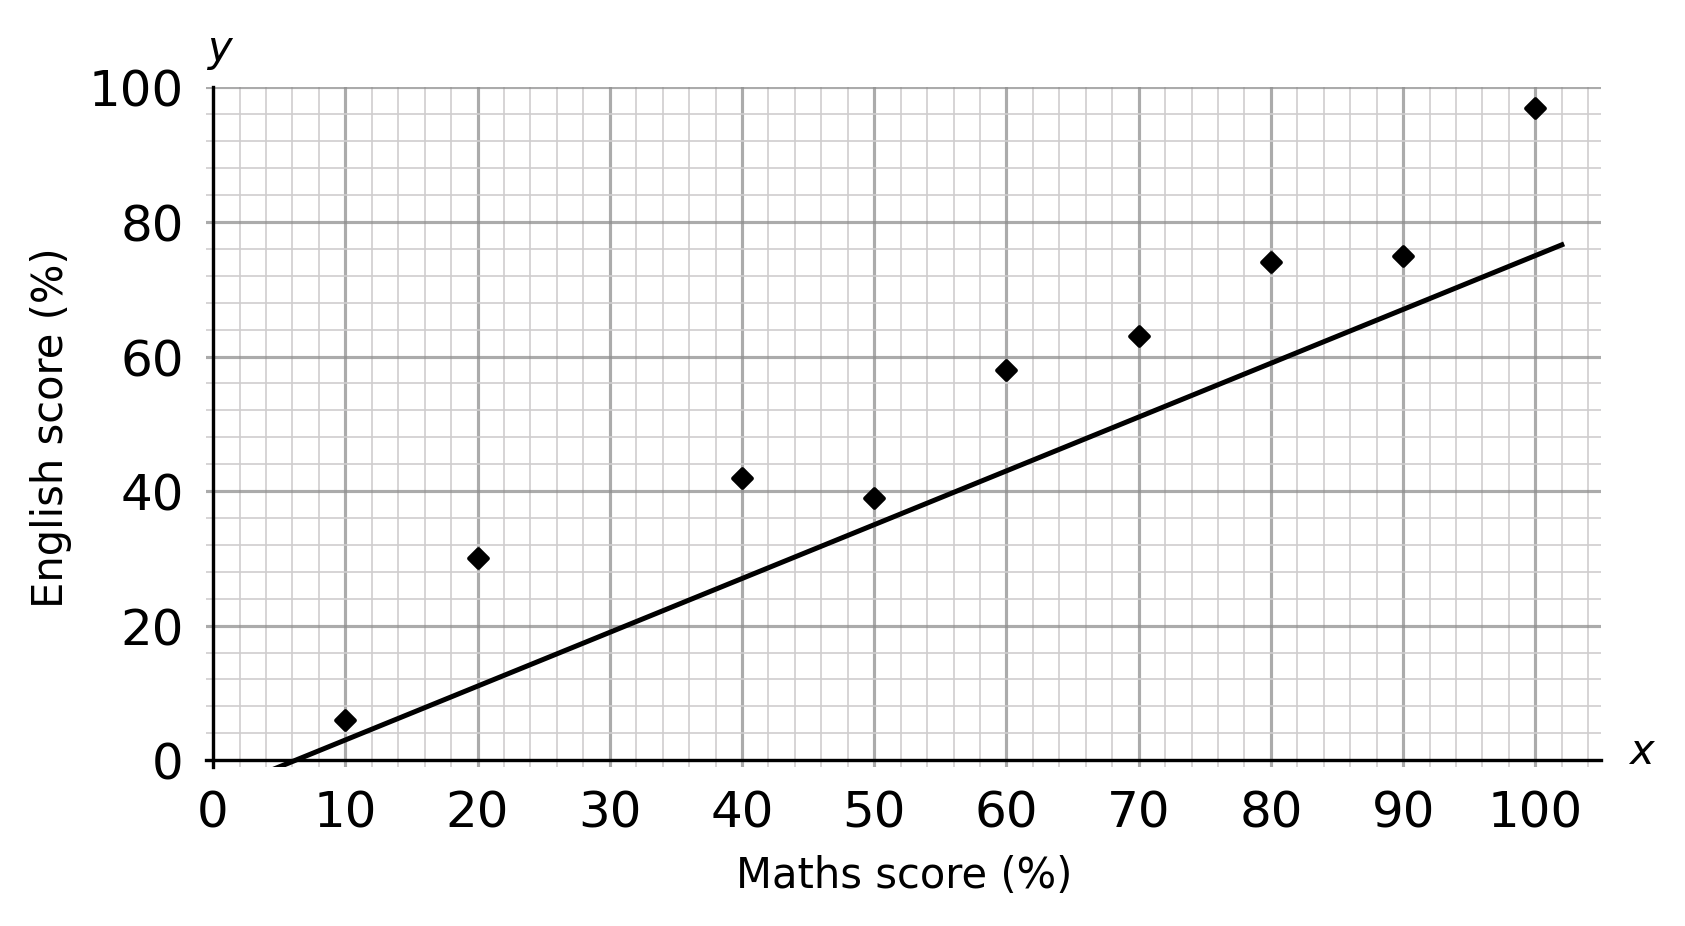
D: 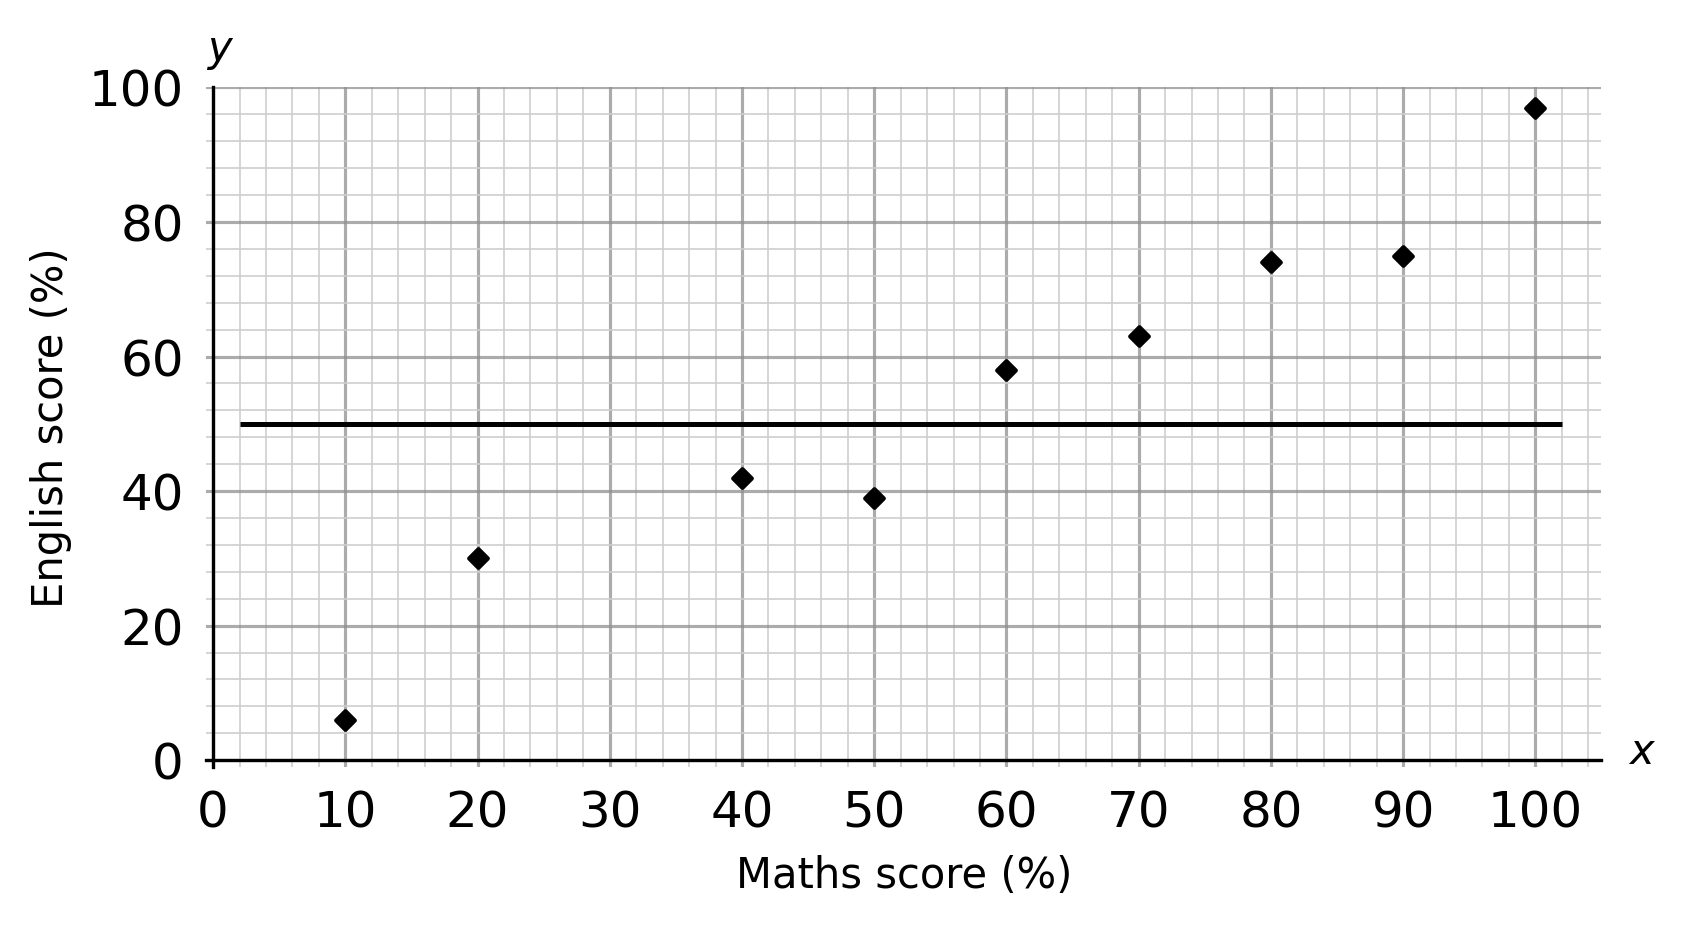
ANSWER: A
Question 4(b): [1 mark]
Another student in the class scores 55\% on their maths test.
Use the graph above to predict their English score.
Choose the best estimate.
Answer type: Multiple choice type 1
A: 50 \%
B: 65 \%
C: 40 \%
D: 80 \%
ANSWER: A: 50 \%
WORKING:
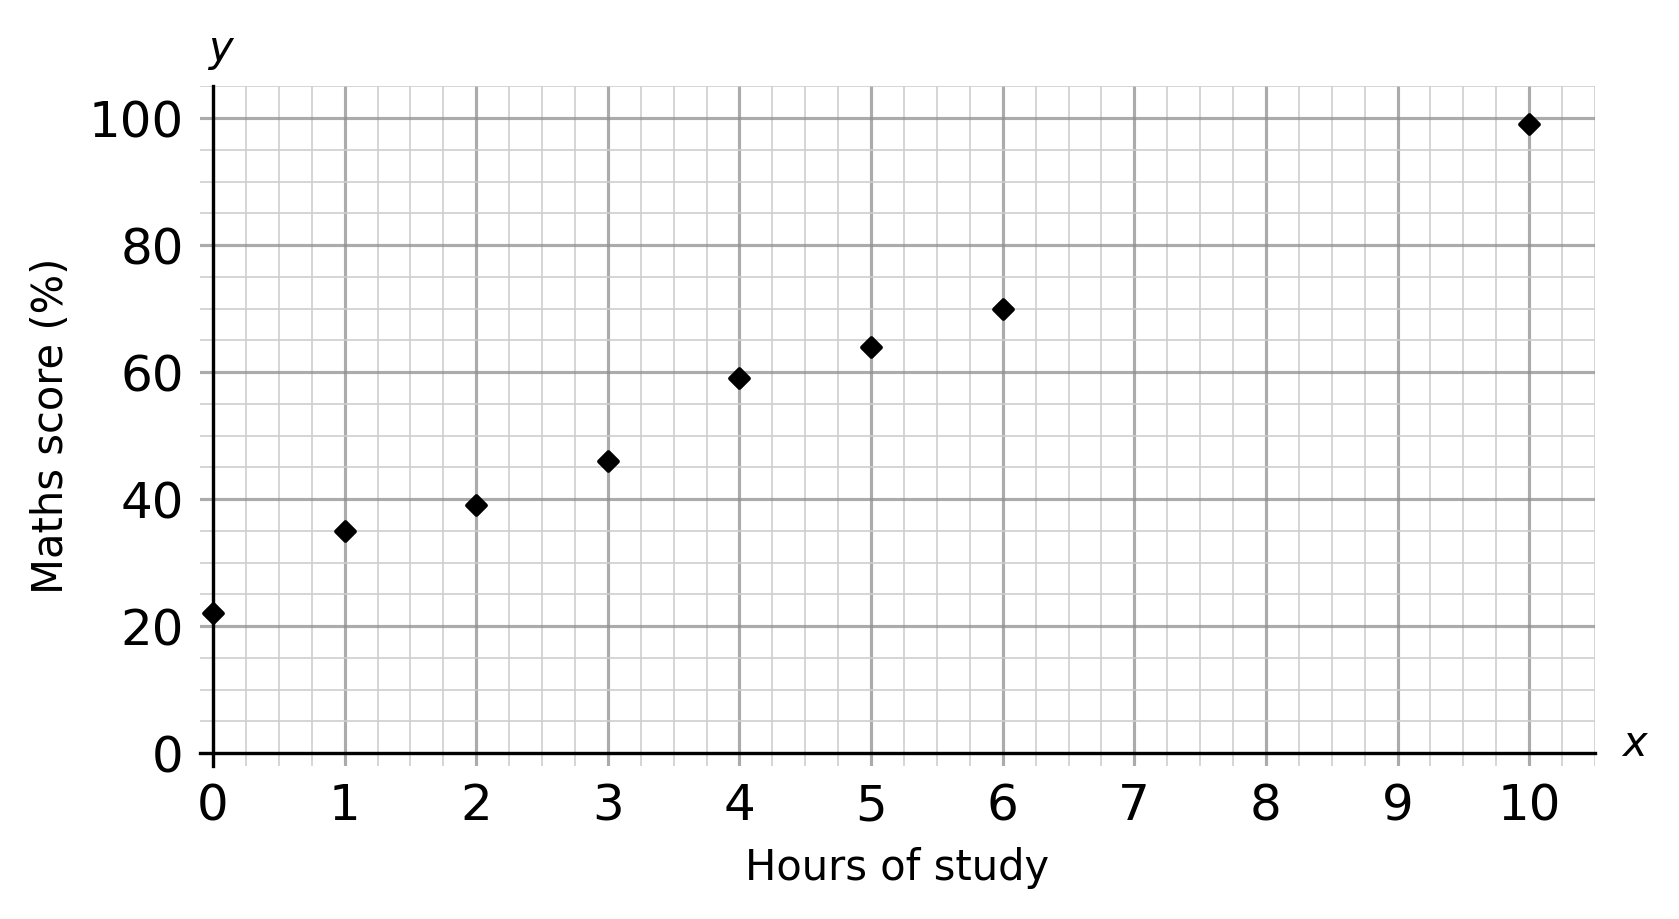
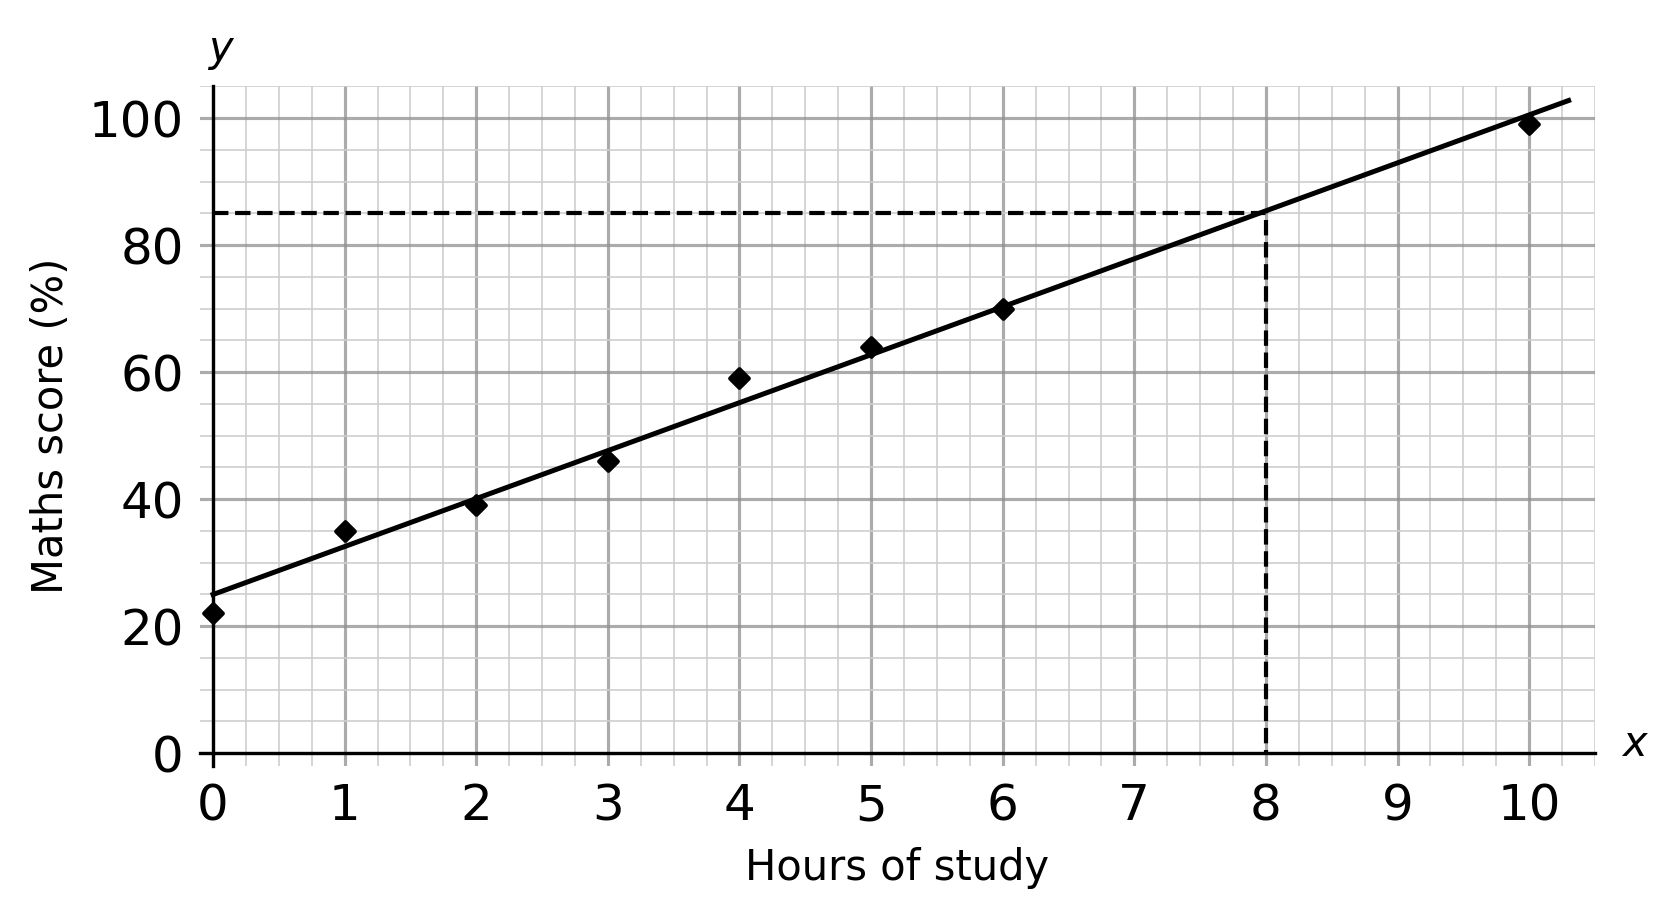
Question 5:
A teacher tracks the number of hours spent studying by students, verses their results in a maths test.
A scatter graph of the results is shown below.
Question 5(a): [1 mark]
Choose the best line of best fit for the scatter graph below.
Answer type: Multiple choice type 1
A: 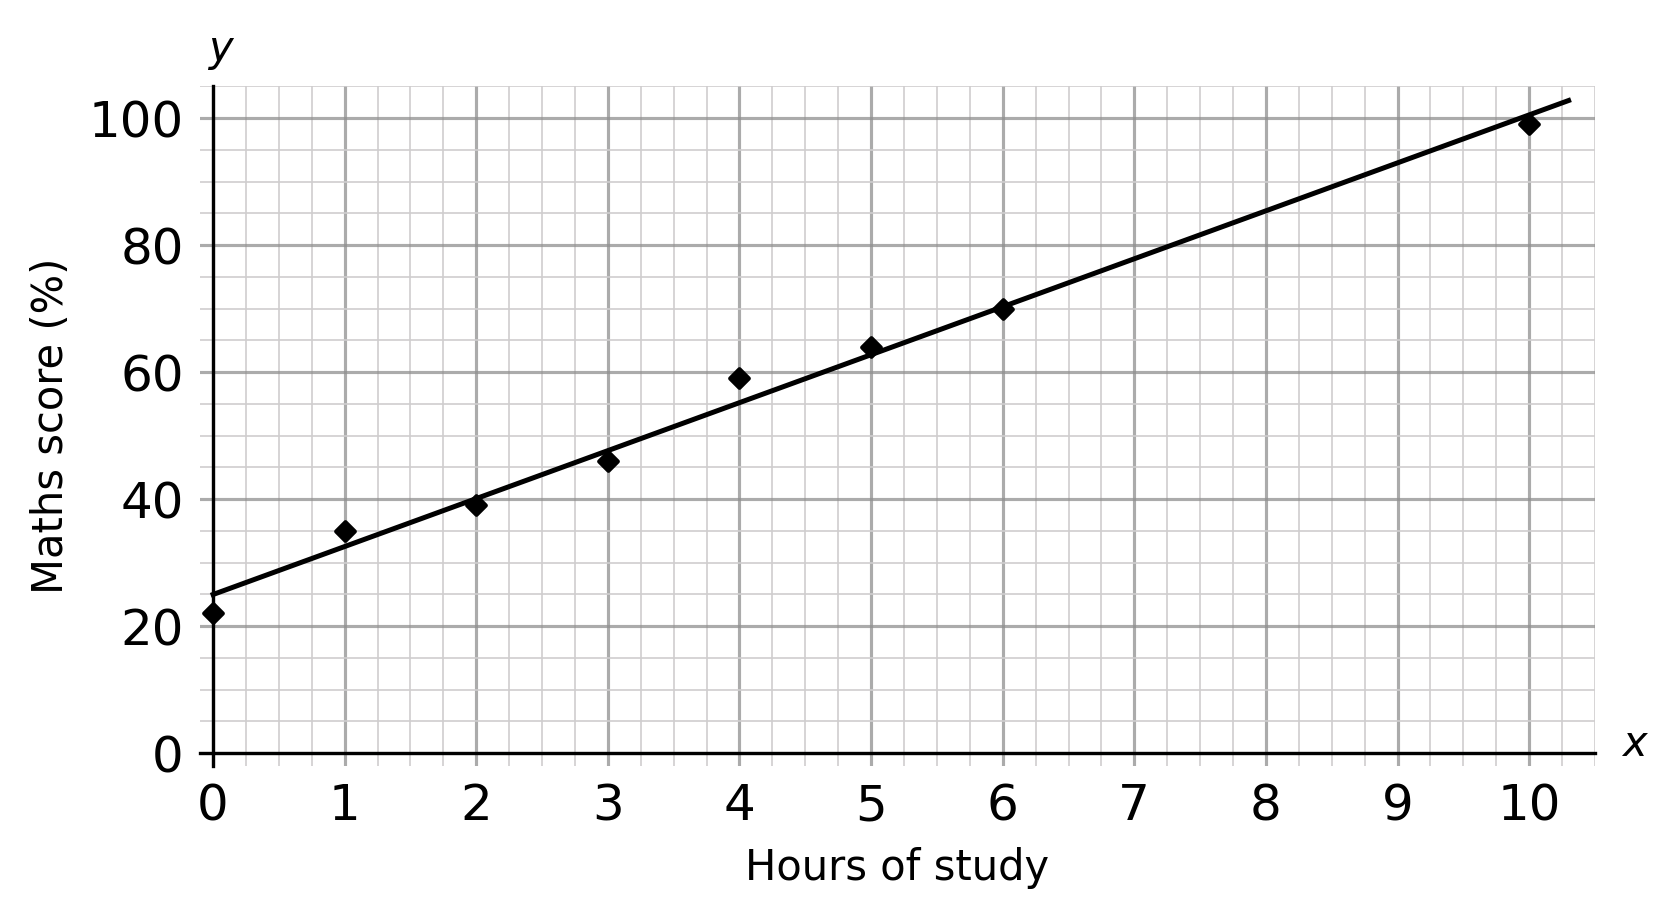
B: 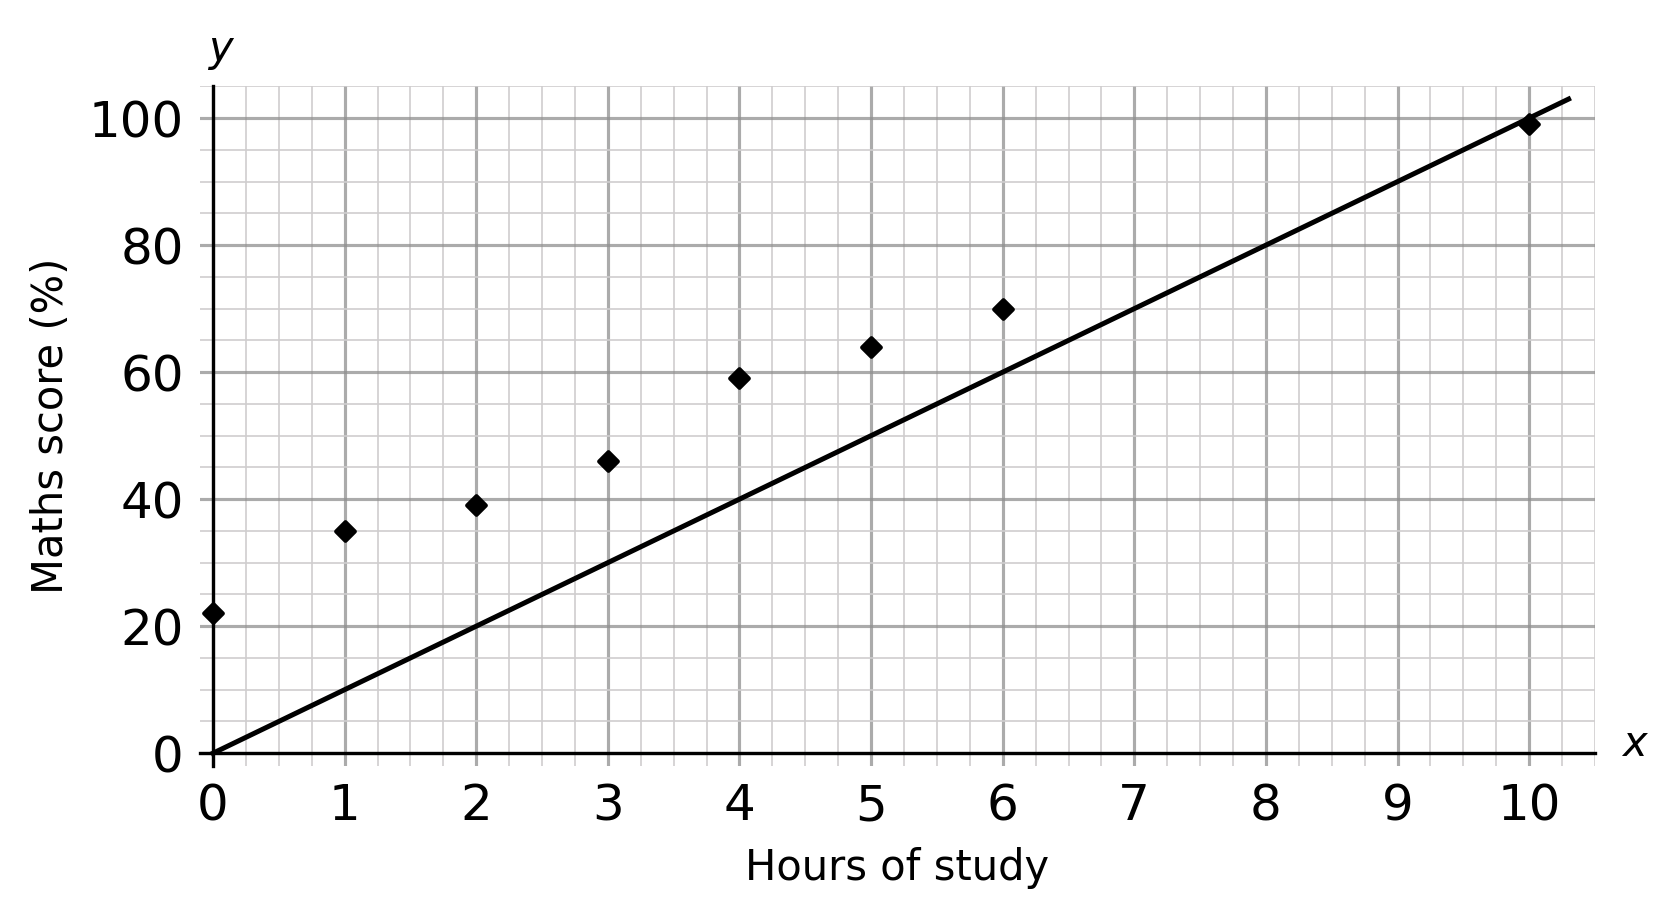
C: 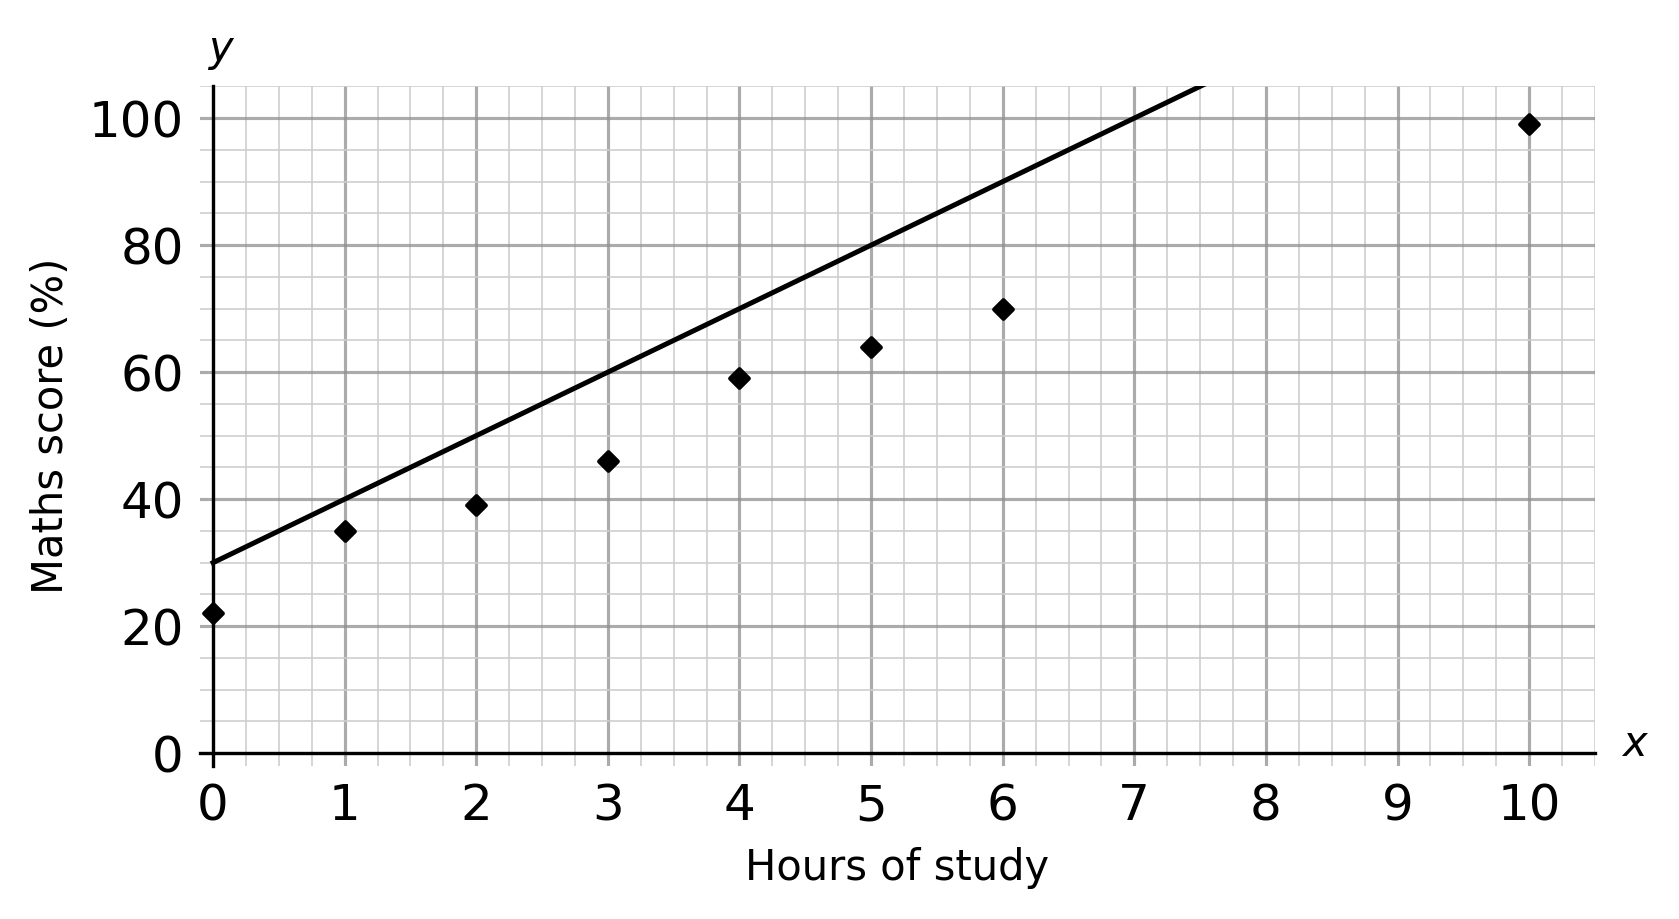
D: 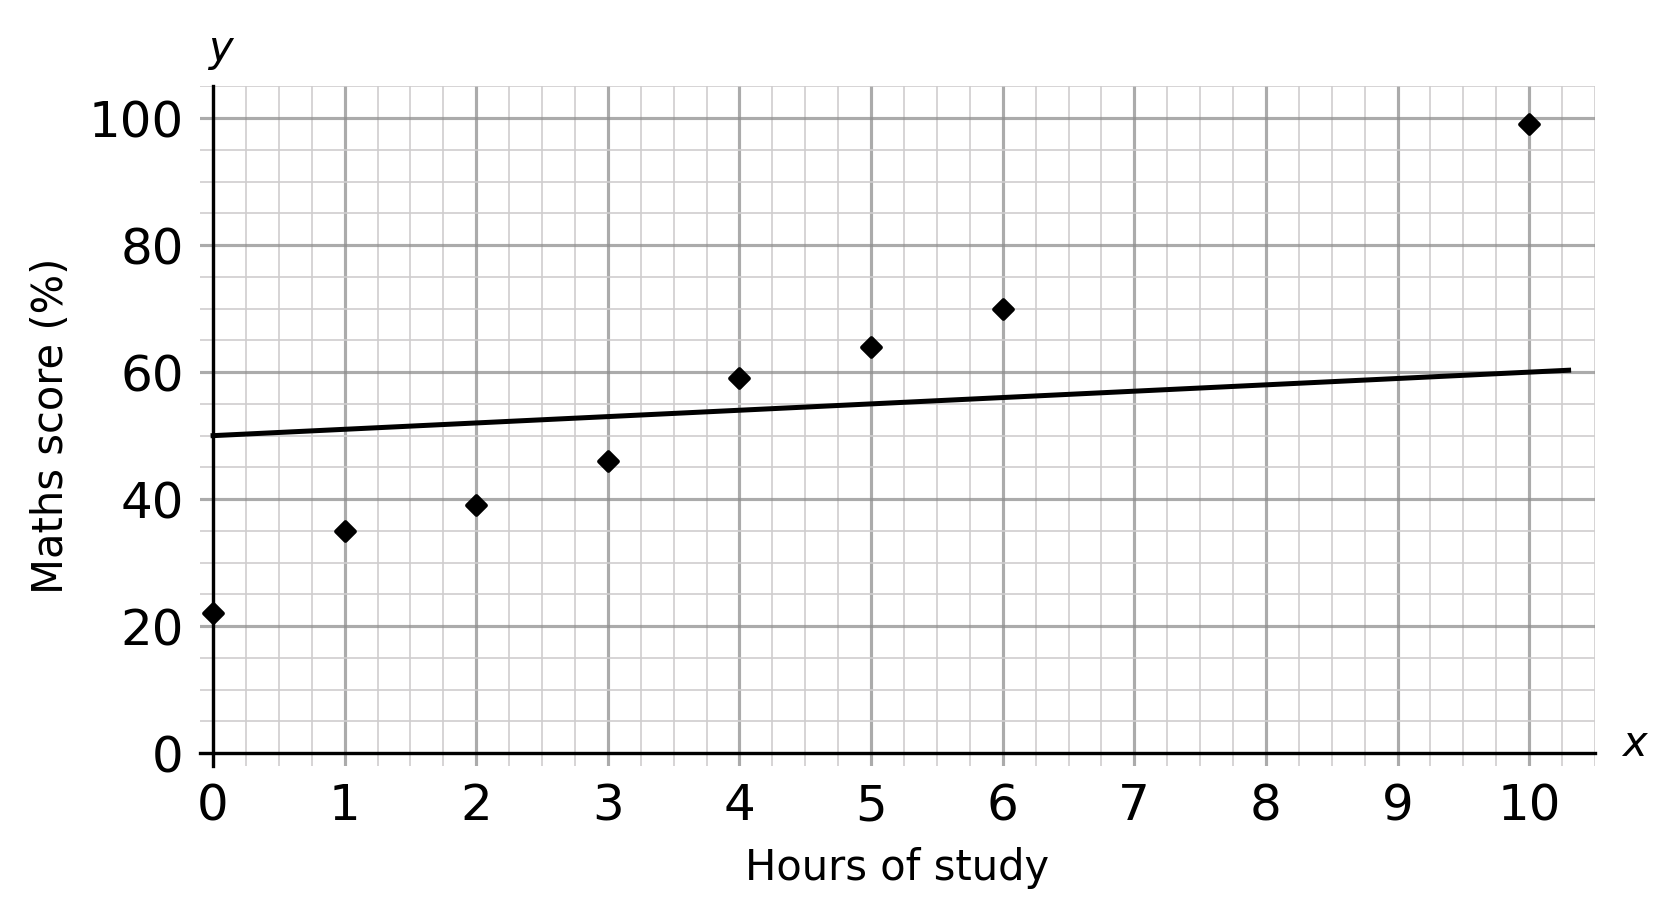
ANSWER: A
Question 5(b): [2 marks]
Based on the data, predict the results of a student who studies for 8 hours.
Choose the best estimate.
Answer type: Multiple choice type 1
A: 85 \%
B: 65 \%
C: 40 \%
D: 50 \%
ANSWER: A: 85 \%
WORKING:
Question 6: [1 mark]
The amount of revision students undertake, in preparation for an English test, is recorded in scatter graph against their results.
A student looks at his data and draws a line of best fit.
The student says, “If I studied for 7 hours, I would get 100\% on my English Test.”
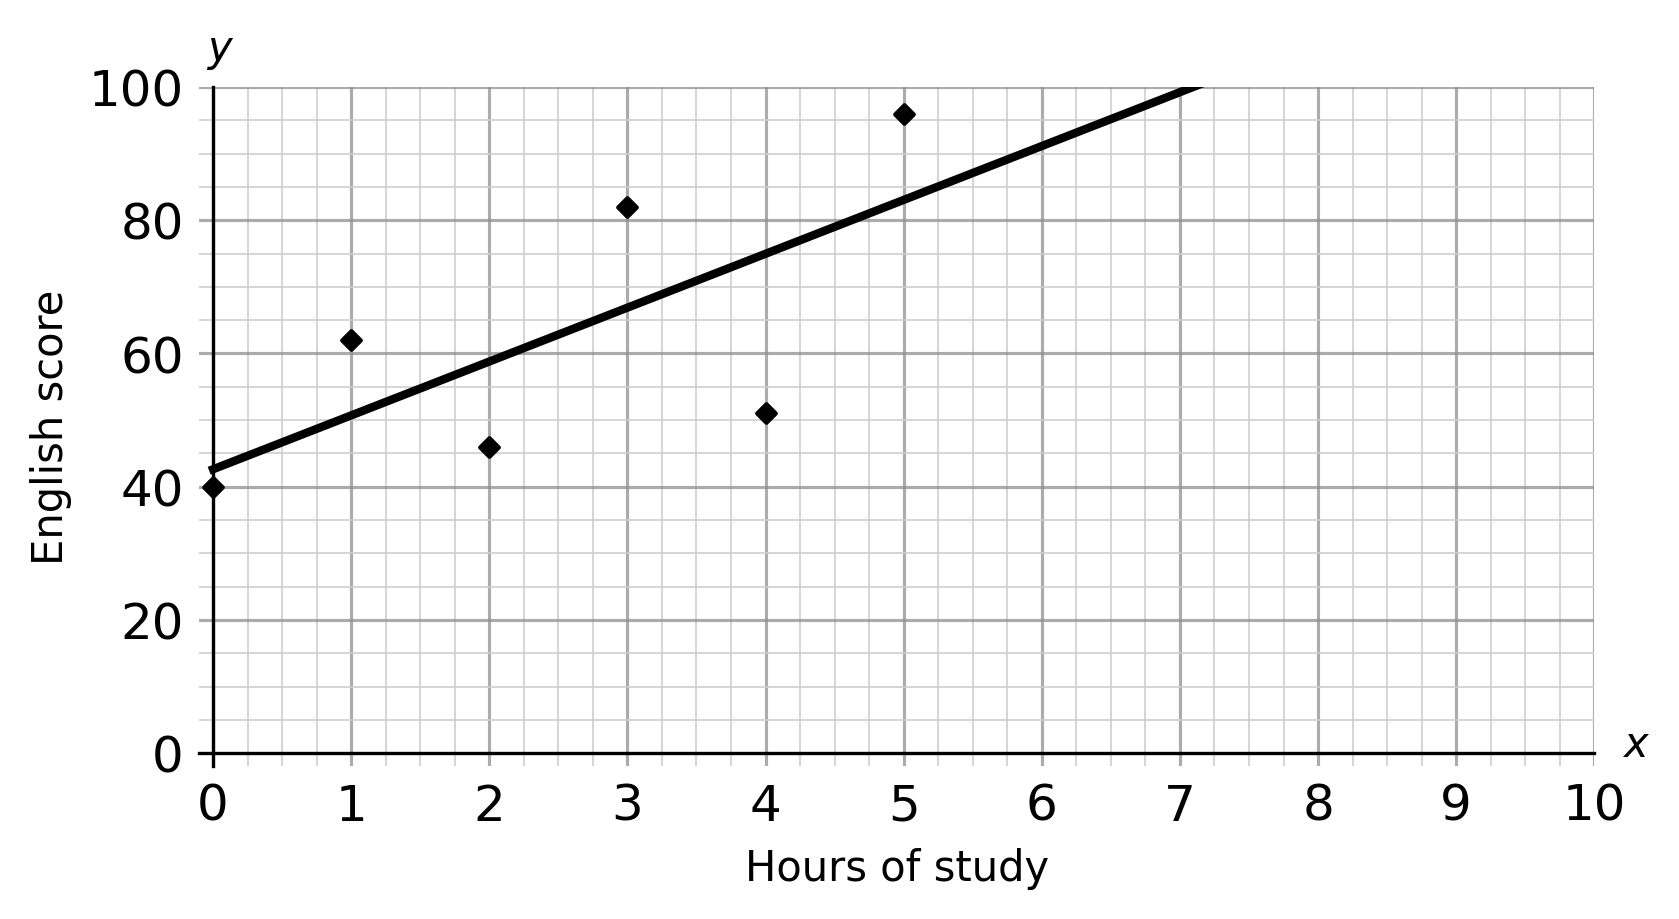
Is the student’s statement true of false?
Answer type: Multiple choice type 2
A: False
B: True
ANSWER: A: False
WORKING:
The line of best fit doesn’t go up to 7 hours, and the line of best fit only gives an estimate.
Question 7:
Data is collected on the number of adults and children taking the bus on several days.
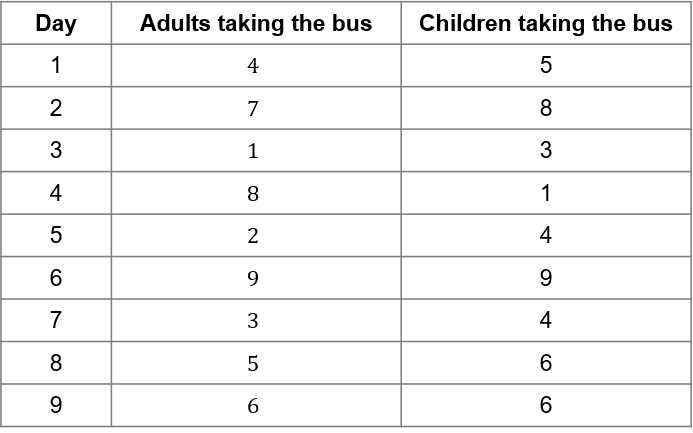
Question 7(a): [2 marks]
Choose the correct scatter plot and line of best fit using the table above.
Answer type: Multiple choice type 1
A: 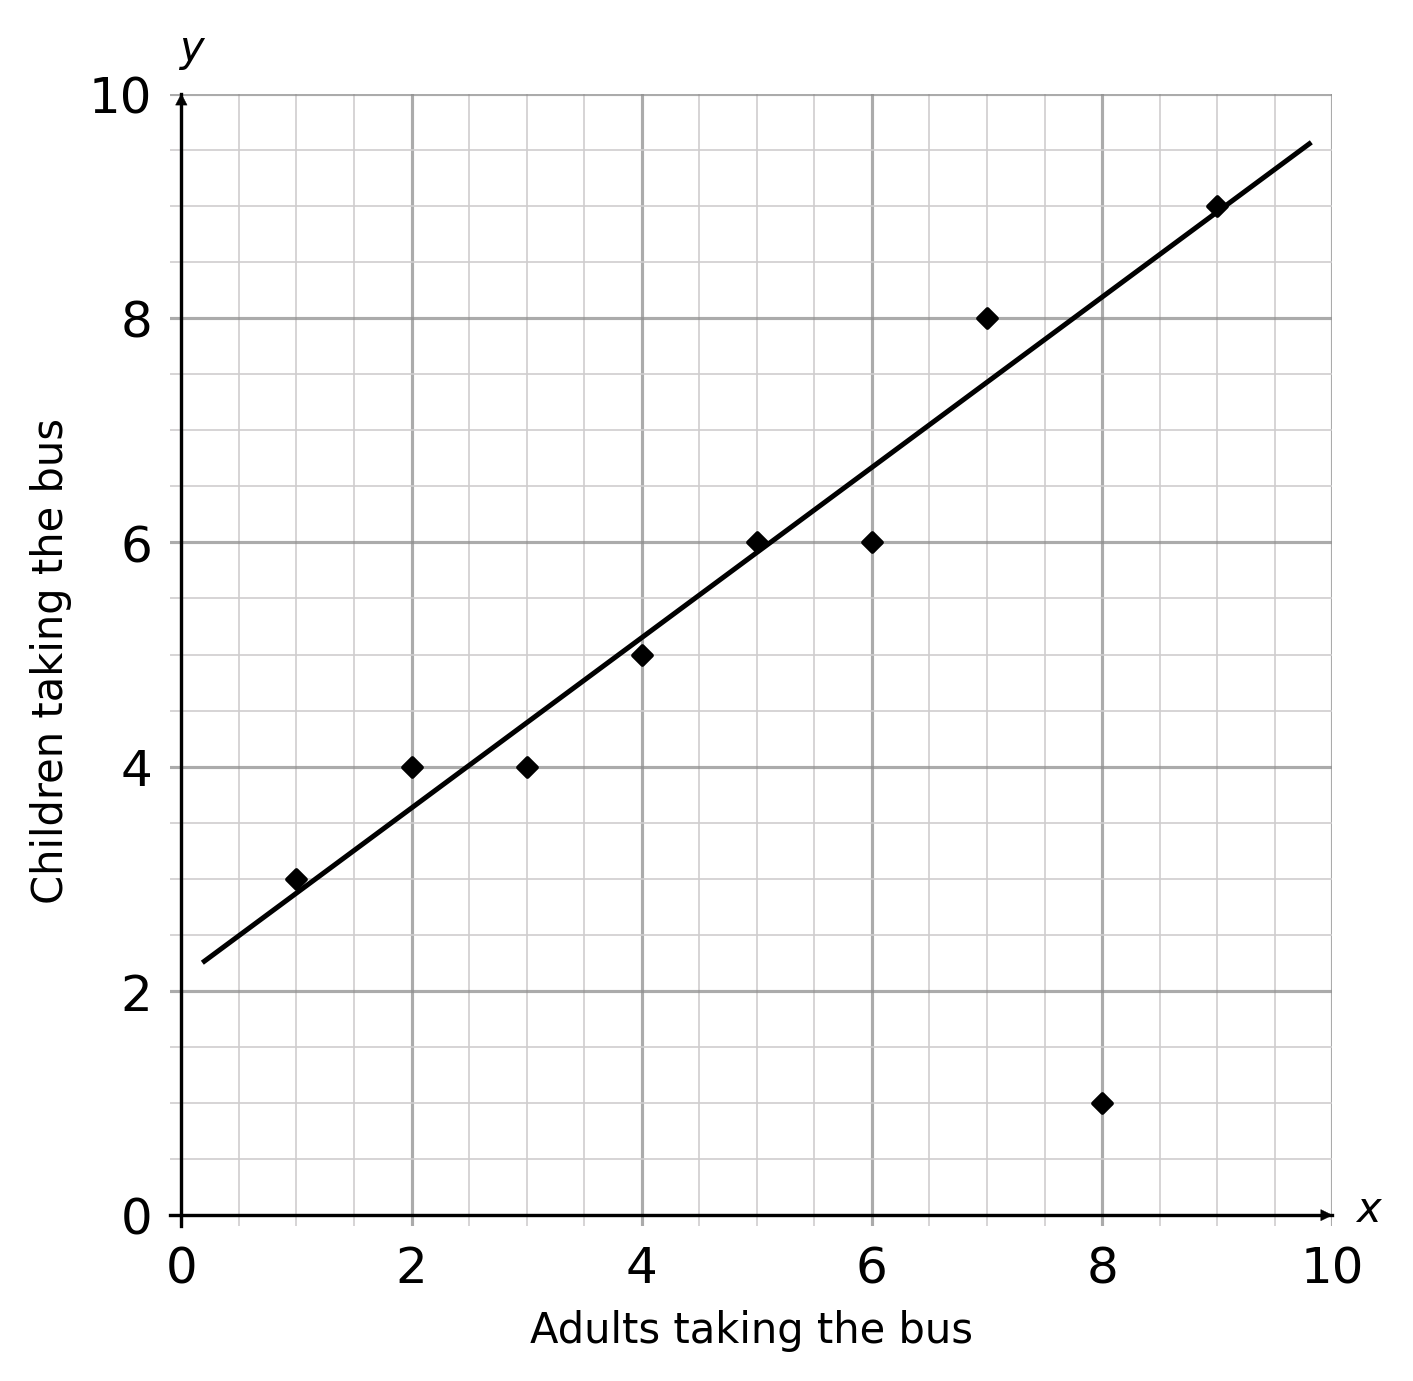
B: 
C: 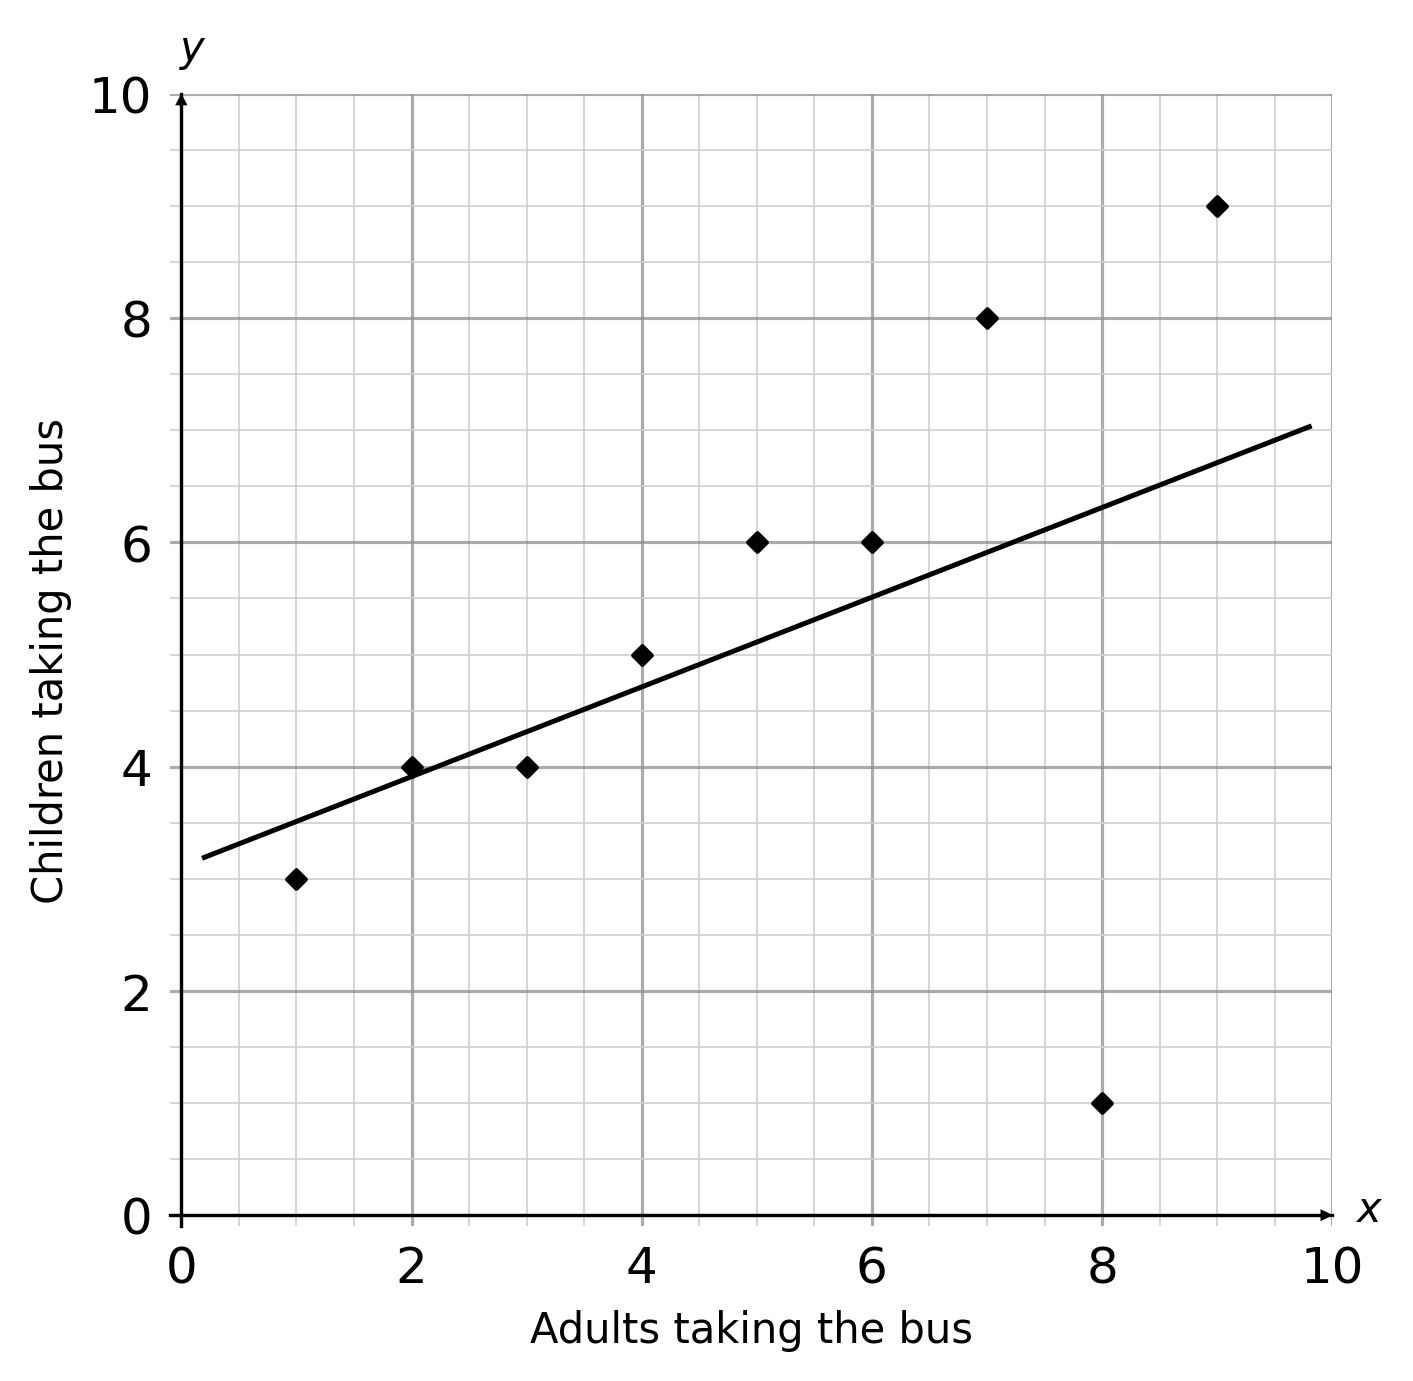
D: 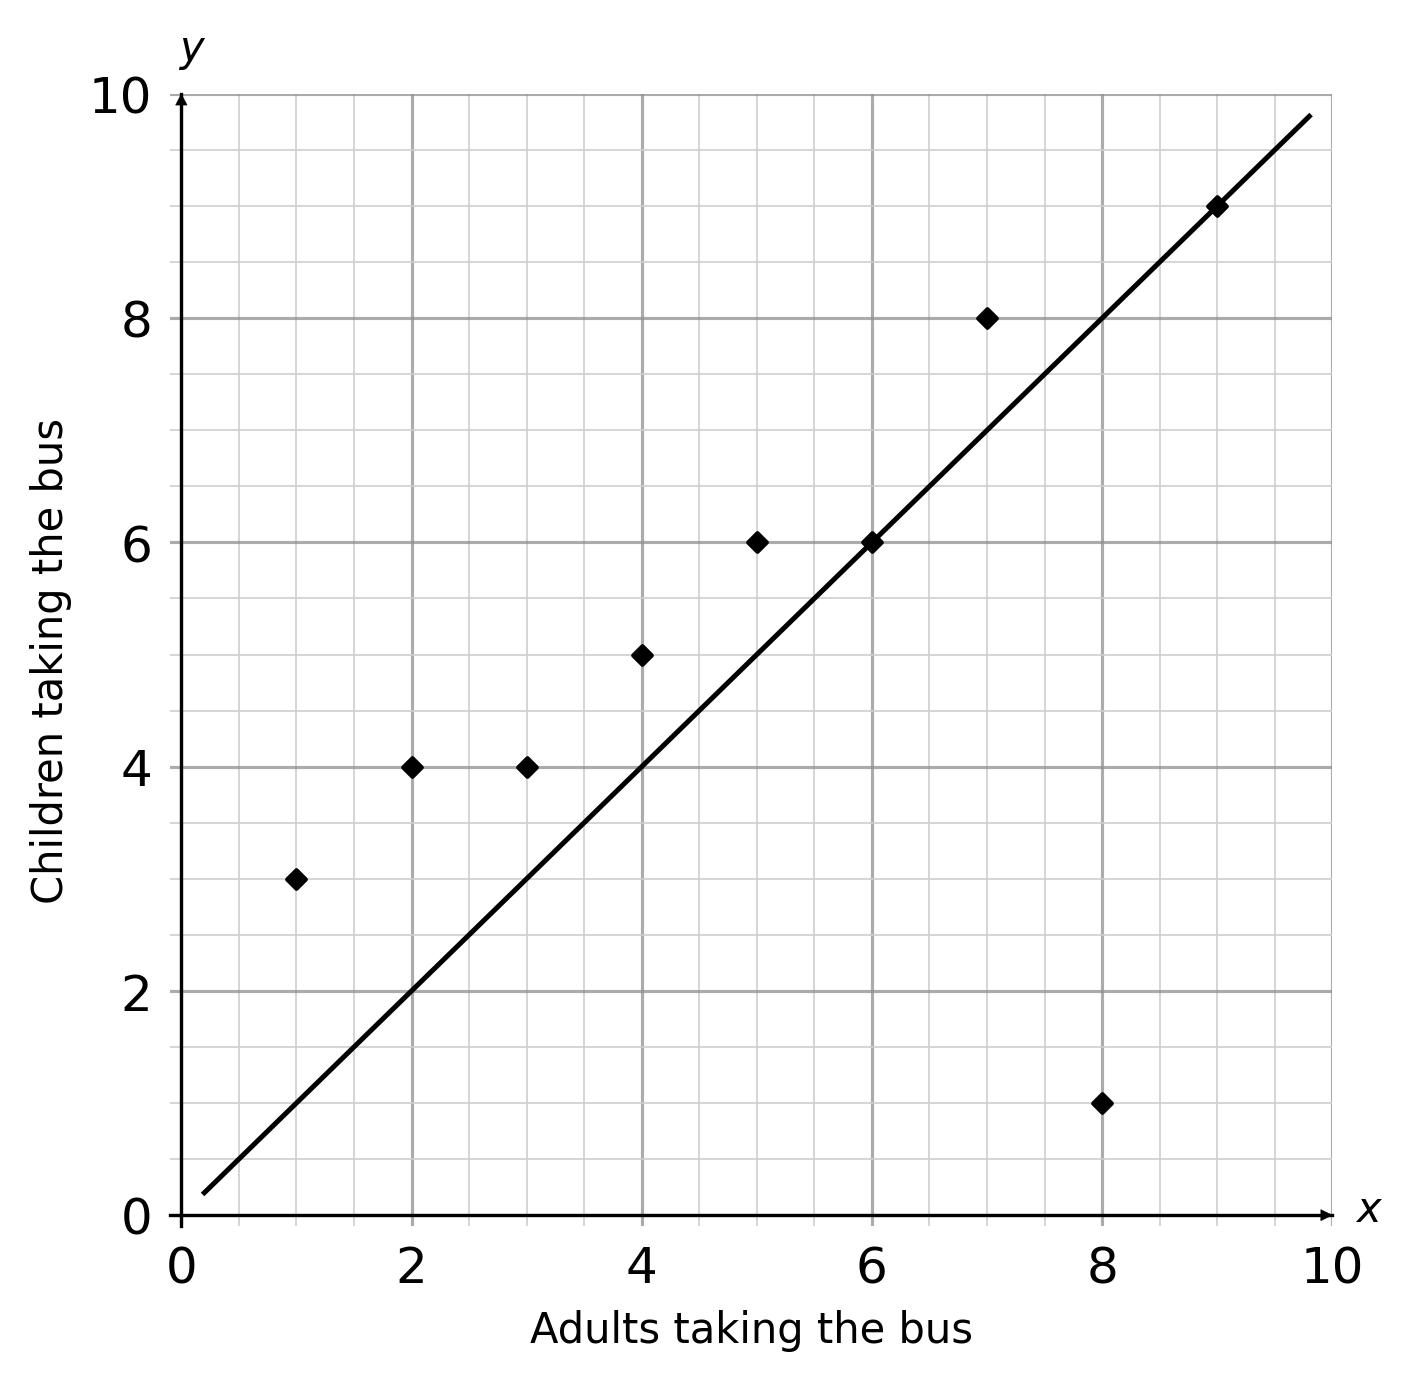
ANSWER: A
Question 7(b): [1 mark]
Find the coordinates of the outlier on the graph.
Answer type: Multiple choice type 1
A: (8,1)
B: (1,3)
C: (9,9)
D: (5,6)
ANSWER: A: (8,1)
WORKING:
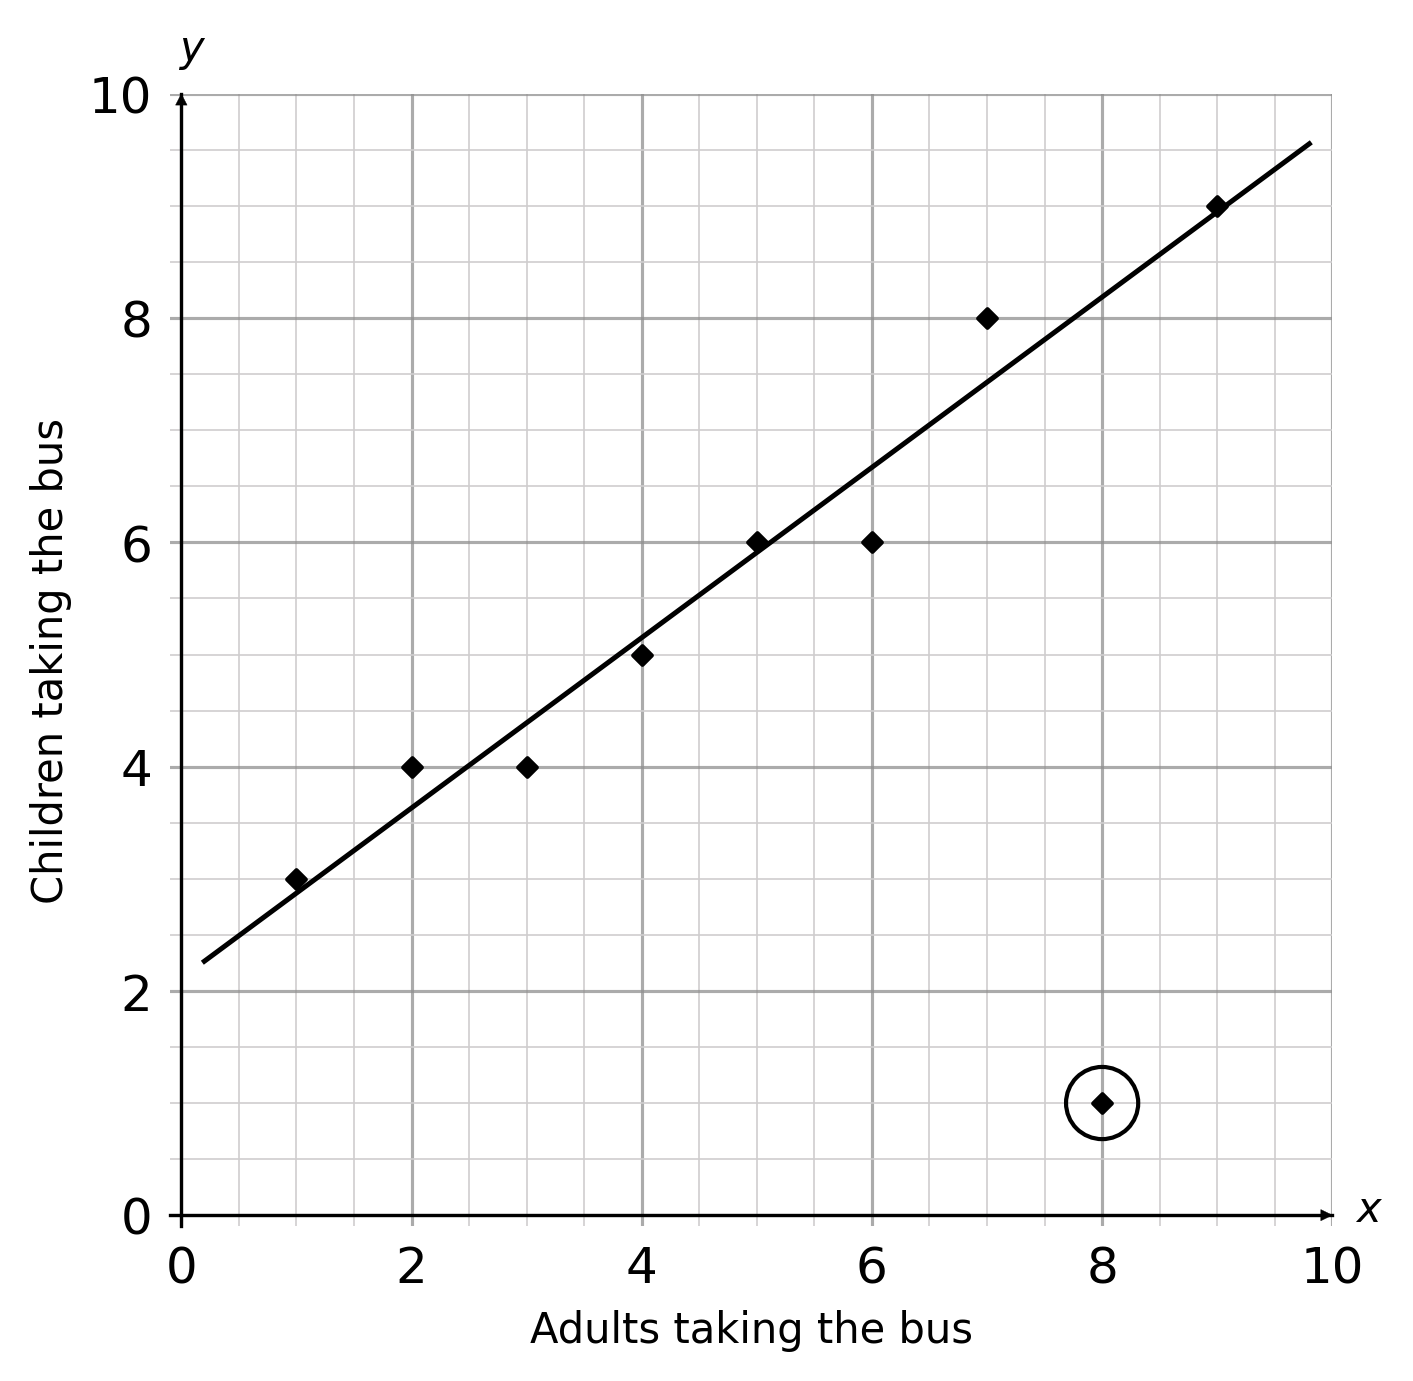
Question 7(c): [1 mark]
If the outlier was removed, what would happen to the line of best fit?
Choose the correct statement.
Answer type: Multiple choice type 2
A: Nothing as lines of best fit ignore outlier data.
B: The gradient would be greater.
C: The gradient would be less.
ANSWER: A: Nothing as lines of best fit ignore outlier data
Question 7(d): [1 mark]
If the one outlier was removed, what would happen to the correlation of the data?
Choose the correct statement.
Answer type: Multiple choice type 2
A: The correlation would be the same.
B: The correlation would be greater.
C: The correlation would be less.
ANSWER: A: The correlation would be the same