Question 1:
A spinner can land of one of three options: red, yellow and blue.
The spinner is biased.
The table below shows the probability that the spinner will land on red and blue.

1(a) Work out the value of x, the probability that the spinner will land in the yellow segment.
Give your answer as a decimal.
ANSWER: Simple text answer
Answer: 0.26
Workings:
\text{P(Red and Blue)}=0.53+0.21=0.74
\text{P(Yellow)}=1-0.74=0.26
Marks = 2
1(b) Pablo spins the spinner 1000 times.
Work out an estimate for the number of times the spinner will land on the red section.
ANSWER: Simple Text Answer
Answer: 530
Workings:
0.53\times1000=530
Marks =1
Question 2
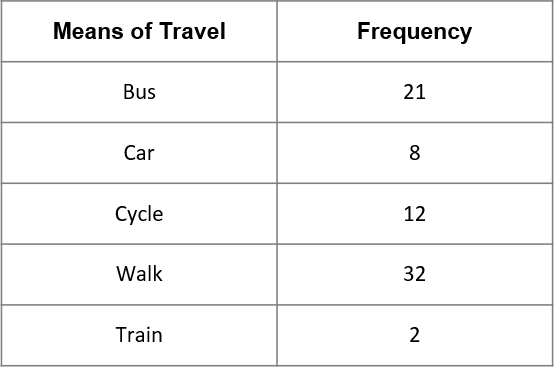
Ben is trying to find out how most of his classmates get to school.
He records the data he takes in the table below.
Find the relative frequency of the following:
Give each answer to 3 decimal places.
2(a) Travelling to school by means of a bus, train or car.
ANSWER: Simple Text Answer
Answer: 0.413
Workings:
\text{Total(B, T or C)}=21+8+2=31
\text{Total number of people}=21+8+12+32+2=75
\text{P(B, T or C)}=\dfrac{31}{75}=0.413
Marks = 2
2(b) Travelling to school by means other than walking.
ANSWER: Simple Text Answer
Answer: 0.573
Workings:
\text{P(not walking)}=1-\dfrac{32}{75}=0.573Marks = 2
Question 3:
Charlotte has a packet of sweets. Her favourites are the red ones and the purple ones.
The table below shows the probability of each different sweet being selected.

3(a) Work out the probability that the sweet Charlotte pulls out of the packet is yellow.
Give your answer as a decimal.
ANSWER: Simple Text Answer
Answer: 0.19
Workings:
\text{P(not Yellow)}=0.15+0.2+0.3+0.16=0.81
\text{P(Yellow)}=1-0.81=0.19
Marks = 2
3(b) There are 35 sweets in one packet.
What number of the sweets are expected to be one of her favourites?
ANSWER: Simple Text Answer
Answer: 12
Workings:
\text{P(Purple or Red)}=0.15+0.2=0.35
0.35\times35=12.25
The answer must be a whole number so 12.25 rounds to 12
Marks = 2
Question 4:
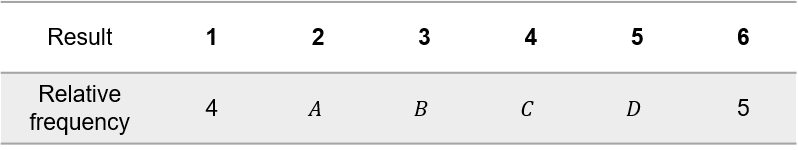
Anna is playing a game called frustration.
Over the course of the game she rolls a dice 25 times and each result is shown below.

4(a) Complete the relative frequency table for this data by giving the values of A, B, C and D.
ANSWER: Multiple Answers (Type 1)
Answers: A=8 B=3 C=3 D=2
Marks = 2
4(b) Based on the results shown in part (a), is the dice is biased?
ANSWER: Multiple Choice
A: Yes
B: No
Answer: Yes
Workings:
Yes, the dice appears to be biased as the number of times it lands on the number 2 is significantly more than the expected result of 25\div 6 \approx 4.
Marks = 2
4(c) Anna rolls the dice 500 times.
Using the relative frequency given, estimate the number of times that it will land on a number six.
ANSWER: Simple text answer
Answer: 100
Workings:
\text{P(5)}=\dfrac{5}{25}=\dfrac{1}{5}
500\times\dfrac{1}{5}=100
Marks = 1
Question 5:
Charlotte wants to estimate the number of sweets in a large packet she has.
The table shows the number of each colour sweet in a small packet.

5(a) Write down the relative frequency of taking a purple sweet out of the small packet.
Give your answer to 3 decimal places.
ANSWER: Simple
Answer: 0.148
Workings:
Total sweets: 4+5+6+2++10=27
Relative frequency: \text{P(Purple)}=\dfrac{4}{27}=0.148
Marks = 2
5(b) Charlotte’s large packet of sweets has 60 sweets.
Use your answer from part (a) to determine the number of purple sweets she should expect to find in the large packet.
ANSWER: Simple
Answer: 9
Workings:
Expected frequency: 0.148\times60=8.88 \approx 9
Marks = 1
Question 6
Tom, Sarah and Mark all roll a biased 5 sided die.
Their results are summarised in the table below.

6(a) Calculate the relative frequency of the die landing on 4 for all three people.
Give each answer to 3 decimal places.
ANSWER: Multiple Answers
Answer:
Tom = 0.167
Sarah = 0.194
Mark = 0.200
Workings:
Totals trials for each person:
\text{Tom}=1+3+1+1=6
\text{Sarah}=10+3+11+7+5=36
\text{Mark}=20+8+18+15+14=75
So the relative frequencies are:
\text{Tom}=\dfrac{1}{6}=0.167
\text{Sarah}=\dfrac{7}{36}=0.194
\text{Mark}=\dfrac{15}{75}=0.200
Marks = 3
6(b) Which persons data is likely to be closest to the actual relative frequency.
ANSWER: Multiple Choice
A: Tom
B: Sarah
C: Mark
D: They are all equal
Answer: Mark
Workings:
Mark did the most trials so his data will be closest to the actual relative frequency.
Marks = 1
7(a) Thomas has a bag containing 200 different coloured marbles.
He wants to find the probability of selecting a white marble.
He does this by randomly selecting a marble out of the bag before replacing it.
Thomas does this 20 times, calculating a relative frequency after every five trials.
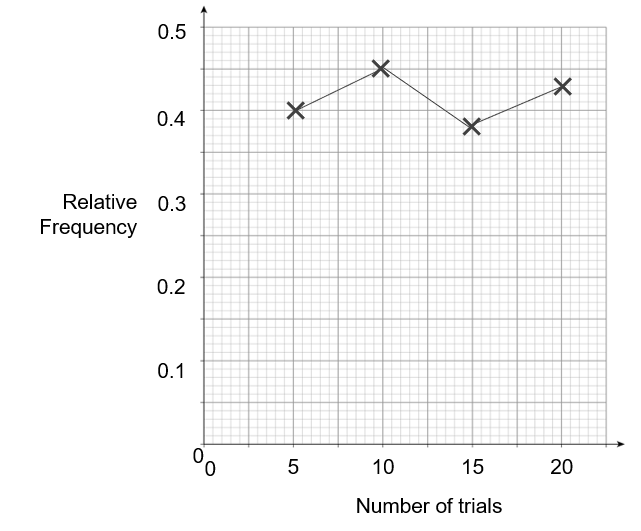
7(a) Use the graph to find the number of white marbles Thomas found after the first 5 trails.
ANSWER: Simple
Answer: 2
Workings:
0.4\times 5=2
Marks = 2
7(b) Estimate the number of white marbles contained within the bag.
ANSWER: Simple
Answer: 86
Workings:
The most accurate value for relative frequency is the value after 20 trial which is 0.43
0.43\times 200=86
Marks =2