Question 1:
Students were asked whether they liked maths or English classes.
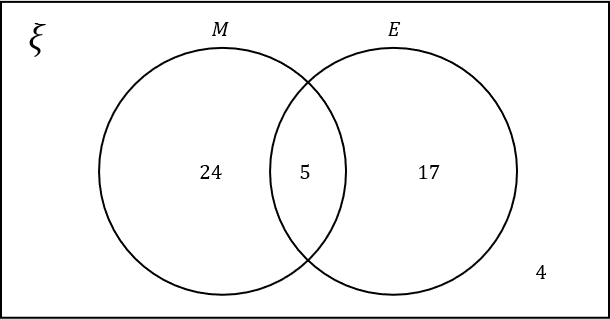
The results are displayed in the Venn diagram below.
 #
#
1(a) What is the probability that a student liked maths?
Give your answer as a fraction in its simplest form.
ANSWER: Fraction
Answer: \dfrac{29}{50}
Workings:
Total number of students that like maths: 24+5=29
Total number of students: 24+5+17+4=50
Probability that student likes maths: \text{P(maths)}=\dfrac{29}{50}
Marks = 1
1(b) What is the probability that a student did not like English?
Give your answer as a fraction in its simplest form.
ANSWER: Fraction
Answer:\dfrac{14}{25}
Workings:
Total number of students that do not like English: 24+4=28
Probability that student does not like English: \text{P(not English)}=\dfrac{28}{50}=\dfrac{14}{25}
Marks = 1
1(c) What is the probability that a student selected a single subject as their preference?
Give your answer as a fraction in its simplest form.
ANSWER: Fraction
Answer: \dfrac{41}{50}
Workings:
Number of students that like maths only: 24
Number of students that like English only: 17
Total number of students that like one subject only: 24+17=41
Probability that student likes one subject only: \text{P(none subject)}=\dfrac{41}{50}=\dfrac{41}{50}
Marks = 1
Question 2:
A survey of 36 pet owners was undertaken.
Two thirds of people said they have a dog.
8 have a dog and a cat.
10 people have only a cat.
2 people have no pets.
Select the correct Venn diagram using the information provided.
ANSWER: Multiple Choice
A: 
B:
C:
D:
Answer: C
Workings:
\dfrac{2}{3}\times36=24 so 24 people in total like dogs.
Of the 24 people that like dogs, 8 also like cats. So there are 8 people in the intersection.
2 people have no pets so these people belong outside the two circles.
Marks = 3