Question 1
LEVEL 6
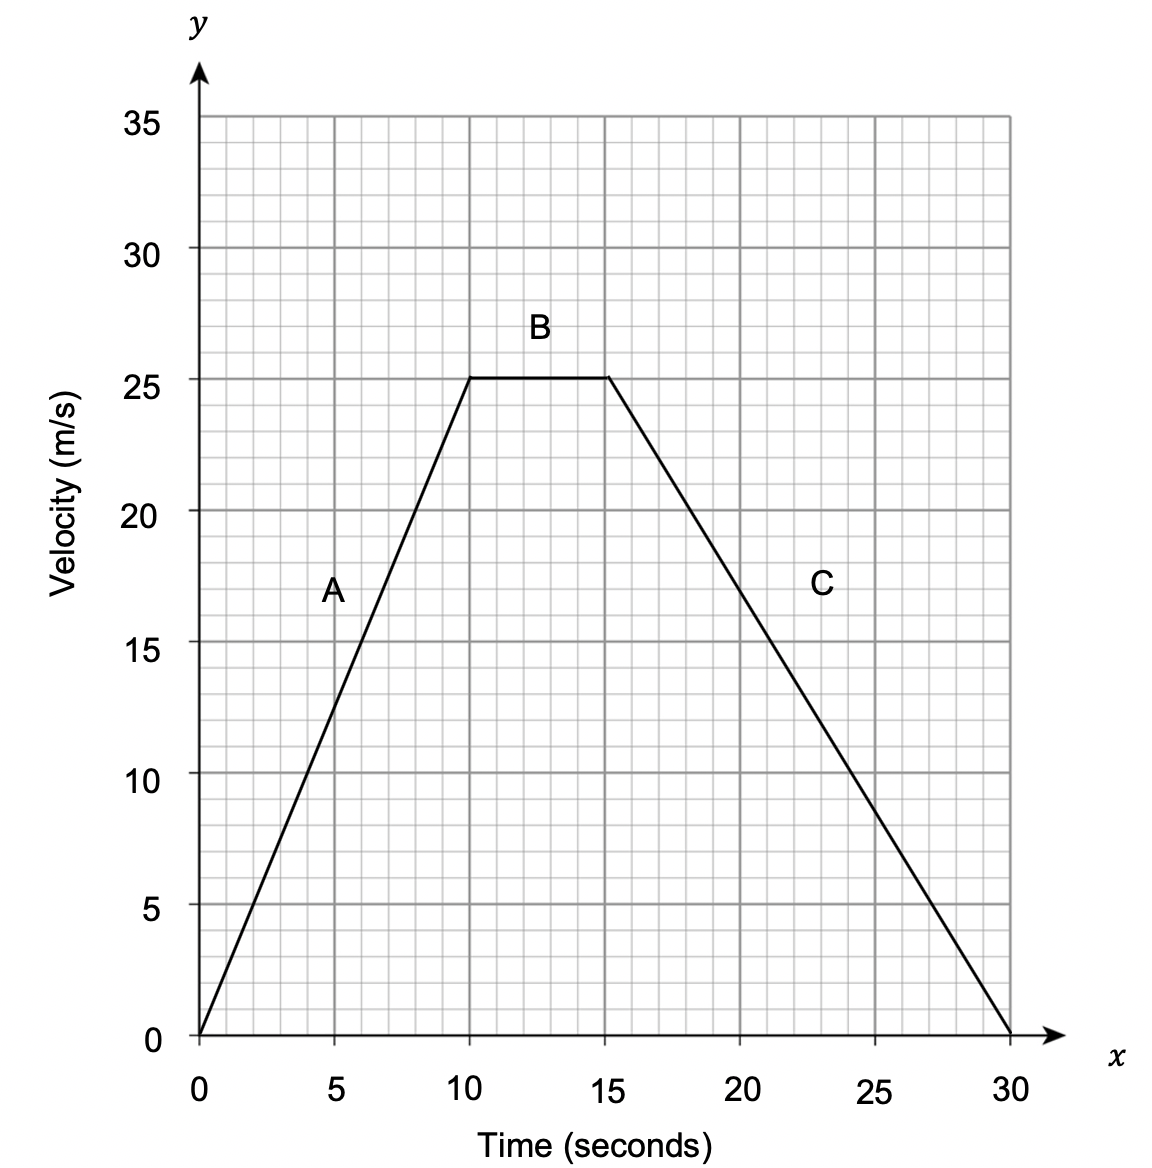
Calculate the distance travelled from the following velocity-time graph.
Select the correct answer from the list below:
A: 125m
B: 250m
C: 375.5m
D: 437.5m
CORRECT ANSWER: D: 437.5m
WORKED SOLUTION:
The distance travelled can be found by calculating the area under the graph.
This can be achieved by splitting the graph up into sections to more easily calculate the area.
So the area can be found by calculating the area of a triangle, a rectangle and another triangle.
Area_1=\dfrac{1}{2}\times10\times25=125m
Area_2=25\times5=125m
Area_3=\dfrac{1}{2}\times15\times25=187.5m
So the total distance travelled,
125+125+187.5=437.5m
Question 2
LEVEL 6
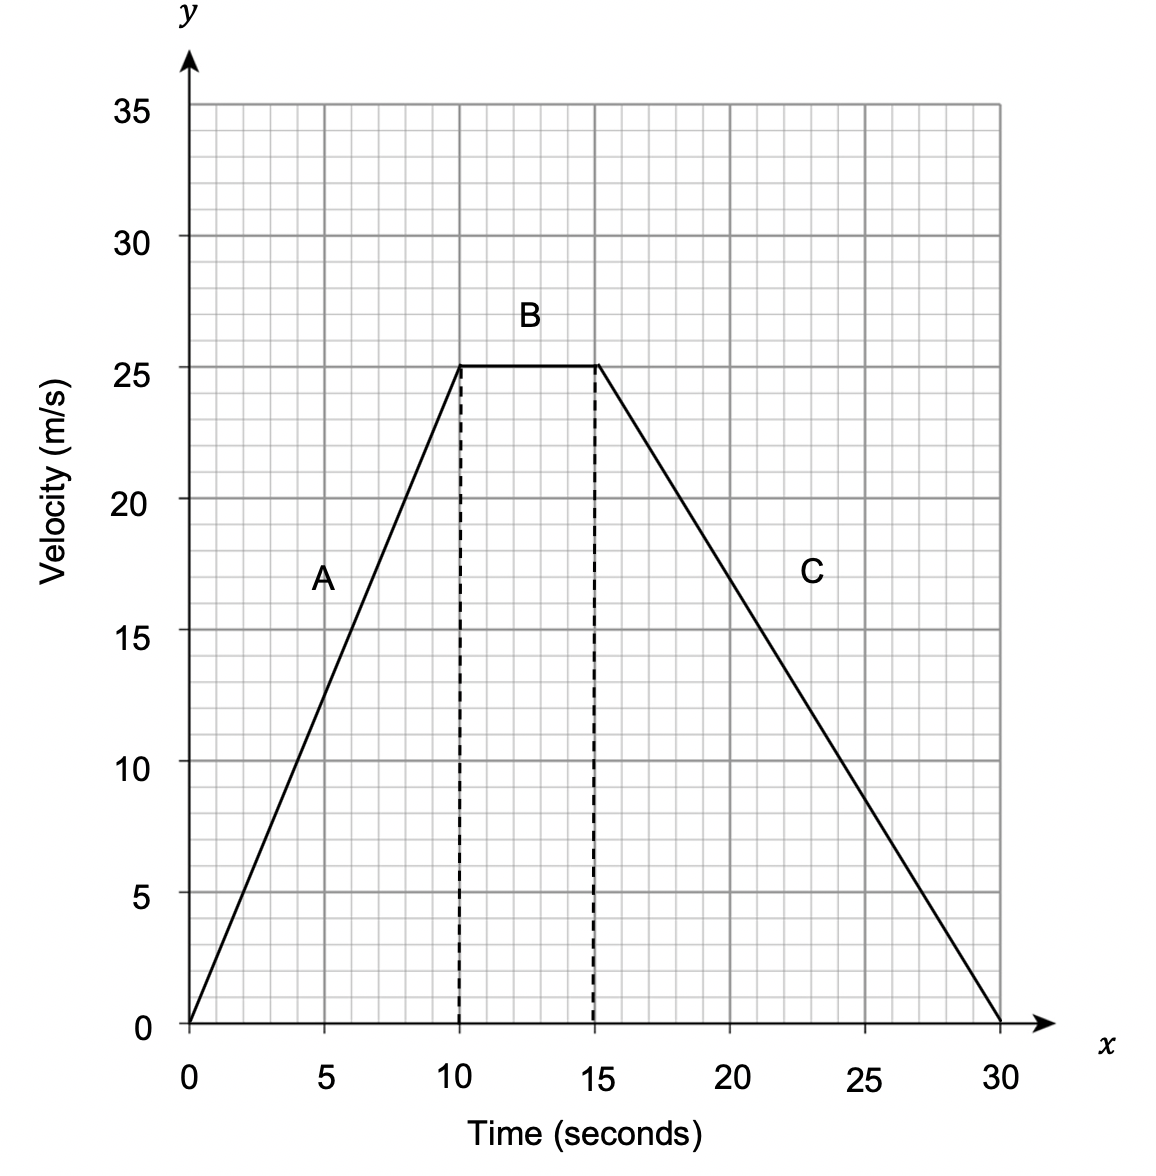
Calculate the acceleration for section A from the following velocity-time graph.
Select the correct answer from the list below:
A: 3 m/s^2
B: 2 m/s^2
C: 2.5 m/s^2
D: 4.5 m/s^2
CORRECT ANSWER: C: 2.5 m/s^2
WORKED SOLUTION:
The acceleration is given by the gradient at any point of the graph.
So for section A, the acceleration is,
\textrm{Gradient }= \dfrac{25-0}{10-0}=2.5 m/s^2
Question 3
LEVEL 6
Calculate the acceleration for section C from the following velocity-time graph.
Select the correct answer from the list below:
A: -\dfrac{5}{3} m/s^2
B: -\dfrac{8}{5} m/s^2
C: -\dfrac{1}{2} m/s^2
D: -\dfrac{3}{2} m/s^2
CORRECT ANSWER: A: -\dfrac{5}{3} m/s^2
WORKED SOLUTION:
The acceleration is given by the gradient at any point of the graph.
So for section C, the acceleration is,
\textrm{Gradient }= \dfrac{0-25}{30-15} =\dfrac{-25}{15}=-\dfrac{5}{3} m/s^2
which is equivalent to a deceleration of \dfrac{5}{3} m/s^2.
Question 4
LEVEL 6
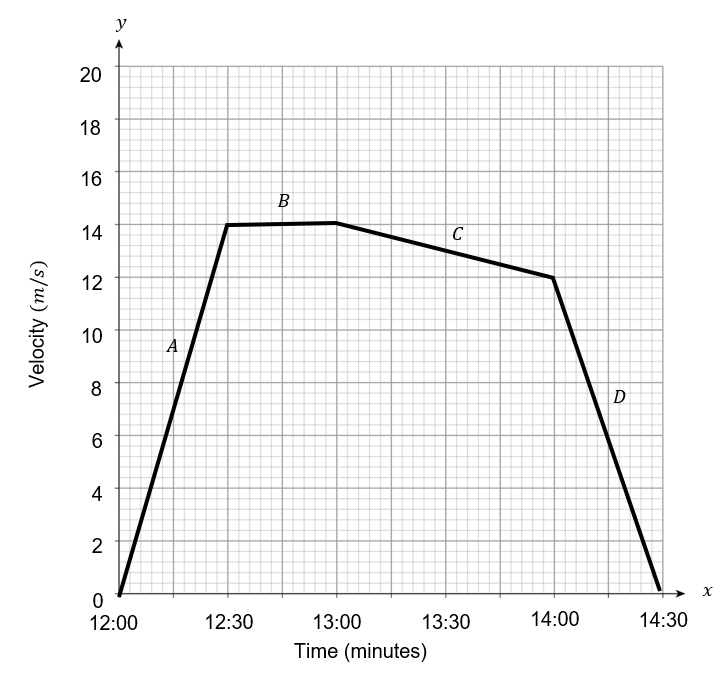
Calculate the acceleration for section A from the following velocity-time graph.
Select the correct answer from the list below:
A: 0.0078 m/s^2
B: 0.078 m/s^2
C: 0.78 m/s^2
D: 7.8 m/s^2
CORRECT ANSWER: A: 0.0078 m/s^2
WORKED SOLUTION:
The acceleration is given by the gradient at any point of the graph.
So for section A, the acceleration is,
\textrm{Gradient }= \dfrac{14}{1800} =\dfrac{7}{900}≅0.0078 m/s^2
Question 5
LEVEL 6
Calculate the distance covered in between 12:00 and 13:00, from the following velocity-time graph.
Select the correct answer from the list below:
A: \text{Distance} =8.25km
B: \text{Distance} =37.8km
C: \text{Distance} =44.8km
D: \text{Distance} =21.3km
CORRECT ANSWER: B: \text{Distance} =37.8km
WORKED SOLUTION:
The distance travelled can be found by calculating the area under the graph.
This can be achieved by splitting the graph up into sections to more easily calculate the area.
So the area can be found by calculating the area of a triangle and a rectangle.
Area_1=\dfrac{1}{2}\times1800\times14=12600m
Area_2=1800\times14=25200m
So the total distance travelled,
12600+25200=37800m
\text{Distance} = 37.8km
Question 6
LEVEL 6
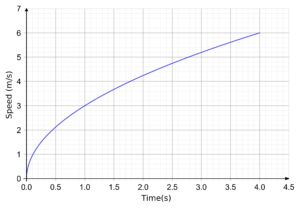
A speed-time graph of the first 4 seconds of someone running a race is shown.
Calculate the average acceleration over the 4 seconds.
Select the correct answer from the list below:
A: 0.67 m/s^2
B: 1.5 m/s^2
C: 0.75 m/s^2
D: 0.33 m/s^2
CORRECT ANSWER: B: 1.5 m/s^2
WORKED SOLUTION:
To work out the average acceleration over the 4 seconds, we will draw a line from where the graph is at 0 to where the graph is at 4s and find the gradient of the line, since the gradient on a speed-time graph gives the acceleration.
So, the average acceleration is
\text{Gradient} = \dfrac{6 - 0}{4 - 0} = 1.5 m/s^2