Question 1
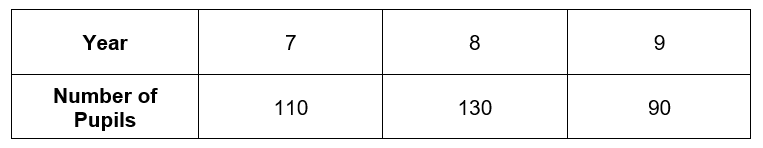
The table below shows the number of pupils in years 7 – 9.
Tom wants to find out information about the pupils in the school.
He wants to take a stratified sample of 10% of the pupils in his year.
Calculate the number of year 7 pupils in the sample.
Select the correct answer from the list below.
A: 10
B: 11
C: 22
D: 33
CORRECT ANSWER: B: 11
WORKED SOLUTION:
Total numbers of students,
110+130+90=330
Number of students from Year 7 strata,
\dfrac{110}{330}\times33=11
Level 6
Question 2
The table below shows the number of pupils in years 7 – 9.
Tom wants to find out information about the pupils in the school.
He wants to take a stratified sample of 25% of the pupils.
Calculate the number of year 9 pupils in the sample.
Select the correct answer from the list below.
A: 23
B: 83
C: 35
D: 33
CORRECT ANSWER: A: 23
WORKED SOLUTION:
Total numbers of students,
110+130+90=330
Number of students from Year 9 strata,
\dfrac{90}{330}\times82.5=22.5
Level 6
Question 3
Alba lives on a small village
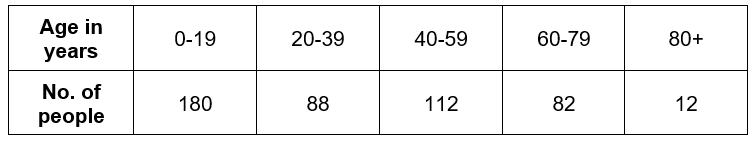
The table below shows the number of people of each age group who live in the village.
She wants to choose a stratified sample of 20%, reflecting each age group, to ask them about the village.
Calculate the number of people in the 20-39 age group.
Give each of your answers to the nearest whole number.
Select the correct answer from the list below.
A: 10
B: 12
C: 16
D: 22
CORRECT ANSWER: C: 16
WORKED SOLUTION:
Total numbers of people,
180+88+112+82+12=474
Number of people between 20-39 ,
\dfrac{80}{474}\times94.8=16
Level 6
Question 4
Alba lives on a small village
The table below shows the number of people of each age group who live in the village.
She wants to choose a stratified sample of 30%, reflecting each age group, to ask them about the village.
Calculate the number of people in the 80+ age group.
Select the correct answer from the list below.
A: 4
B: 6
C: 5
D: 7
CORRECT ANSWER: A: 4
WORKED SOLUTION:
Total numbers of people,
180+88+112+82+12=474
Number of people between 20-39 ,
\dfrac{12}{474}\times142.2=3.6
Level 6
Question 5
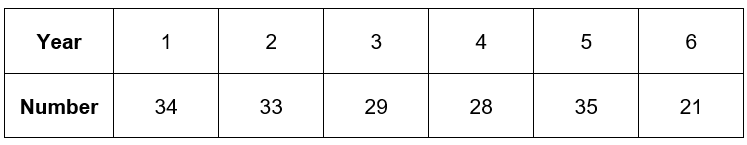
The table below shows the number of pupils in each year for a prestigious primary school.
A stratified sample of 36 pupils need to be selected for a yearly questionnaire.
How many students should be selected from year 4
Give your answer to the nearest whole student.
Select the correct answer from the list below.
A: 6
B: 8
C: 10
D: 7
CORRECT ANSWER: A: 6
WORKED SOLUTION:
Total numbers of students,
34+33+29+28+35+21=180
Number of students in year 6 ,
\dfrac{28}{180}\times36=5.6
Level 6
Question 6
The table below shows the number of pupils in each year for a prestigious primary school.
A stratified sample of 28 pupils need to be selected for a yearly questionnaire.
How many students should be selected from year 6.
Give your answer to the nearest whole student.
Select the correct answer from the list below.
A: 6
B: 3
C: 8
D: 5
CORRECT ANSWER: B: 3
WORKED SOLUTION:
Total numbers of students,
34+33+29+28+35+21=180
Number of students in year 6,
\dfrac{21}{180}\times28=3.2
Level 6