Question 1
The following grouped frequency table shows the time taken by a class of students to finish the 1500m.

Find an estimate for the mean time taken.
Give your answer to 3 significant figures.
Select the correct answer from the list below:
A: 7.07 minutes
B: 7.98 minutes
C: 8.29 minutes
D: 9.51 minutes
CORRECT ANSWER: C: 8.29 minutes
WORKED SOLUTION:
To find an estimate for the mean we need to multiply the midpoint of each group by its frequency, add them, then divide by the total frequency. This is most easily done by adding two new columns and a new row.

And now we just need to divide these.
\dfrac{373}{45}=8.29
Level 5
Question 2
The grouped frequency table below shows the time taken for 55 international flights out of an airport.

Use this information to calculate an estimate for the mean flight time of the 55 flights.
Select the correct answer from the list below:
A: 5.3 hours
B: 6.2 hours
C: 4.7 hours
D: 7.5 hours
CORRECT ANSWER: B: 6.2 hours
WORKED SOLUTION:
(12\times1)+ (15\times3)+(8\times5)+(7\times8)+(5\times12)+(8\times16)=341341\div 55=6.2 hours
Level 5
Question 3
A fairground attraction, required people to throw darts to earn a score.
The results of all the participants from one days game are shown in the frequency table below.
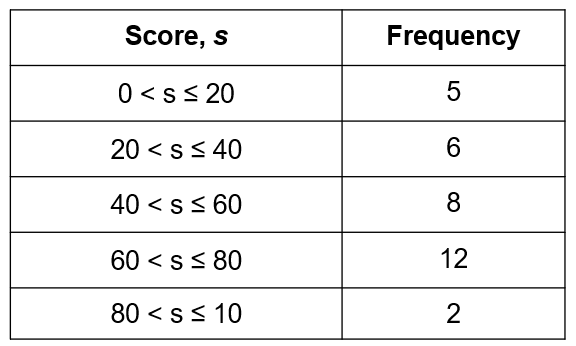
Use this information to calculate an estimate for the mean score for the day.
Select the correct answer from the list below:
A: 44
B: 50
C: 61
D: 57
CORRECT ANSWER: B: 50
WORKED SOLUTION:
(10\times5)+ (30\times6)+(50\times8)+(70\times12)+(90\times2)=1650
1650\div 33= 50
Level 5
Question 4
The time taken in minutes for a group of students to complete are puzzle is shown in the grouped frequency table below.
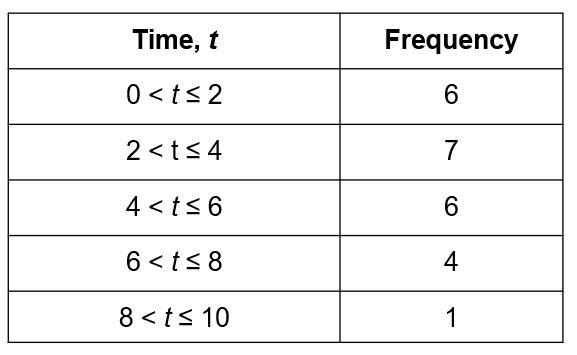
Use this information to calculate an estimate for the mean time taken.
Select the correct answer from the list below:
A: 5.2
B: 4.1
C: 3.9
D: 4.7
CORRECT ANSWER: C: 3.9
WORKED SOLUTION:
(1\times6)+ (3\times7)+(5\times6)+(7\times4)+(9\times1)=9494\div24= 3.9
Level 5
Question 5
The number of minuses people exercised the previous day is shown in the grouped frequency table below:
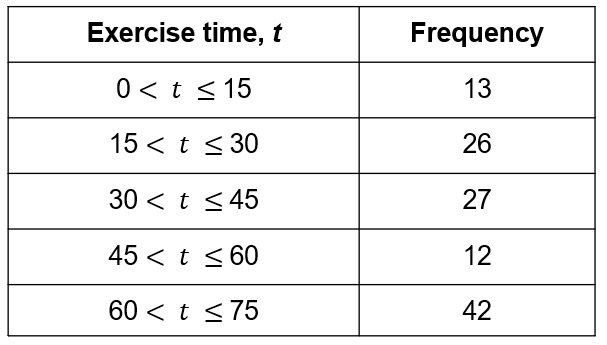
Use this information to calculate an estimate for the mean time taken.
Select the correct answer from the list below:
A: 43.00
B: 41.75
C: 45.50
D: 36.25
CORRECT ANSWER: A: 43.00
WORKED SOLUTION:
(7.5\times13)+ (22.5\times26)+(37.5\times27)+(52.5\times12)+(67.5\times42)=51604710\div120= 43.00
Level 5