Question 1
Tom, Stephan, Amir and jack share a pack of sweets
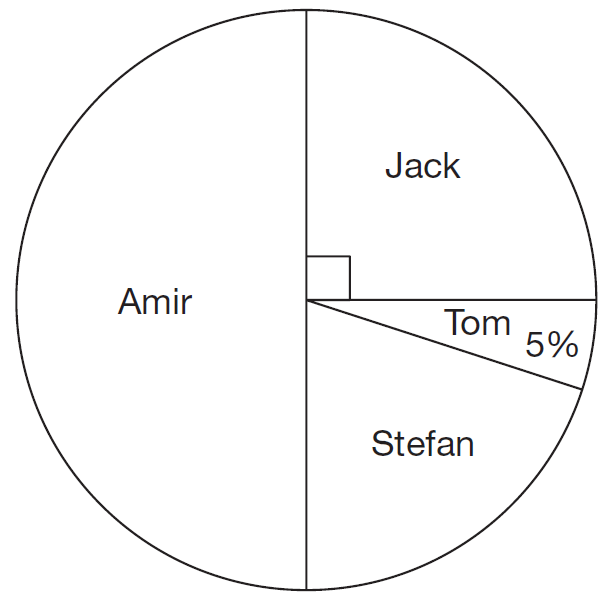
Tom receives 10 sweets.
How many sweets does Amir receive?
Select the correct answer from the list below:
A: 10
B: 40
C: 65
D: 100
CORRECT ANSWER: D: 100
WORKED SOLUTION:
5\% of the circle is 10 sweets.
Therefore 50\% of the circle represents 100 sweets
Level 3
Question 2
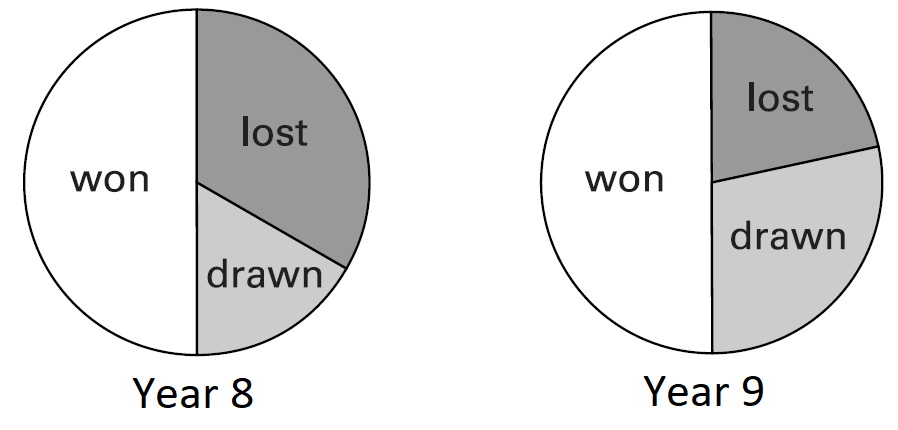
Two pie charts are shown below, showing the results of the football games for year 8 and year 9 football teams.
Select which of the statements are correct.
A: Tommy says year 9 lost more as their segment is smaller.
B: Petre says both year 8 and 9 won the same amount of games
C: Dawn says Year 9 won more then year 8
D: John says you cannot tell who won the most games.
CORRECT ANSWER: D: John says you cannot tell who won the most games.
WORKED SOLUTION:
John is correct as there is no information of how many games each team has played so you cannot tell who won the most games.
Level 3
Question 3
Two pie charts are shown below, showing the results of the football games for year 8 and year 9 football teams.
During the year, year 8 played 20 games, and year 9 played 30 games.
Select which of the statements are correct.
A: Year 8 won the most games
B: Year 9 won the most games.
C: They both won the same number of games
D: Cannot tell.
CORRECT ANSWER: B: Year 9 won the most games.
WORKED SOLUTION:
As both won the same proportion of games (half), Year 8 won 10 games whereas year 9 won 15 games.
Level 3
Question 4
The method of all the employees of a company got to work are shown in the pie chart below.
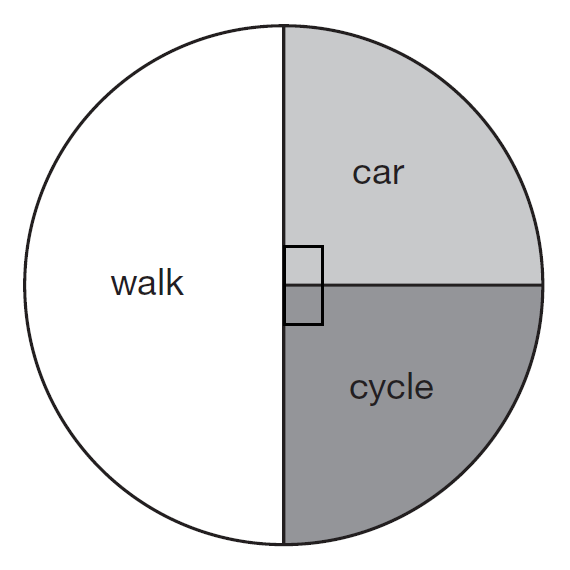
Overall 35 people cycled to work.
How many people are in the company overall?
Select which of the statements are correct.
A: 70
B: 135
C: 180
D: 140
CORRECT ANSWER: D: 140
WORKED SOLUTION:
35 people represents a qarter of the total staff so,
35\times 4 = 140Level 3
Question 5
The method of all the employees of a company got to work in 2016 are shown in the pie chart below.
The method of all the employees of a company got to work in 2017 are shown in the pie chart below.
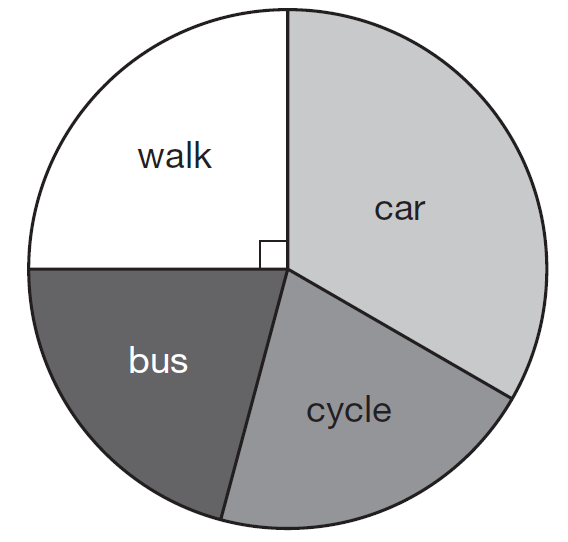
In 2016 the company employed 62 people.
In 2017 the company employed 124 people.
Did more people walk to work in 2016 or 2017?
How many people are in the company overall?
Select which of the statements are correct.
A: 2016
B: 2017
C: The same number
D: Cannot tell
CORRECT ANSWER: C: The same number
WORKED SOLUTION:
0.5\times 62=31 people who walked in 2016
0.25\times 124=31 people who walked in 2017
Level 3